Z-Scores are a great #Stats tool to help give us some insight into a data set, especially in the #Bitcoin and On-Chain world.
So, what exactly is a Z-Score? What is it good for? What are its limitations? What kinds of Z-Scores are there?
Let's dive in.👇🧵
So, what exactly is a Z-Score? What is it good for? What are its limitations? What kinds of Z-Scores are there?
Let's dive in.👇🧵
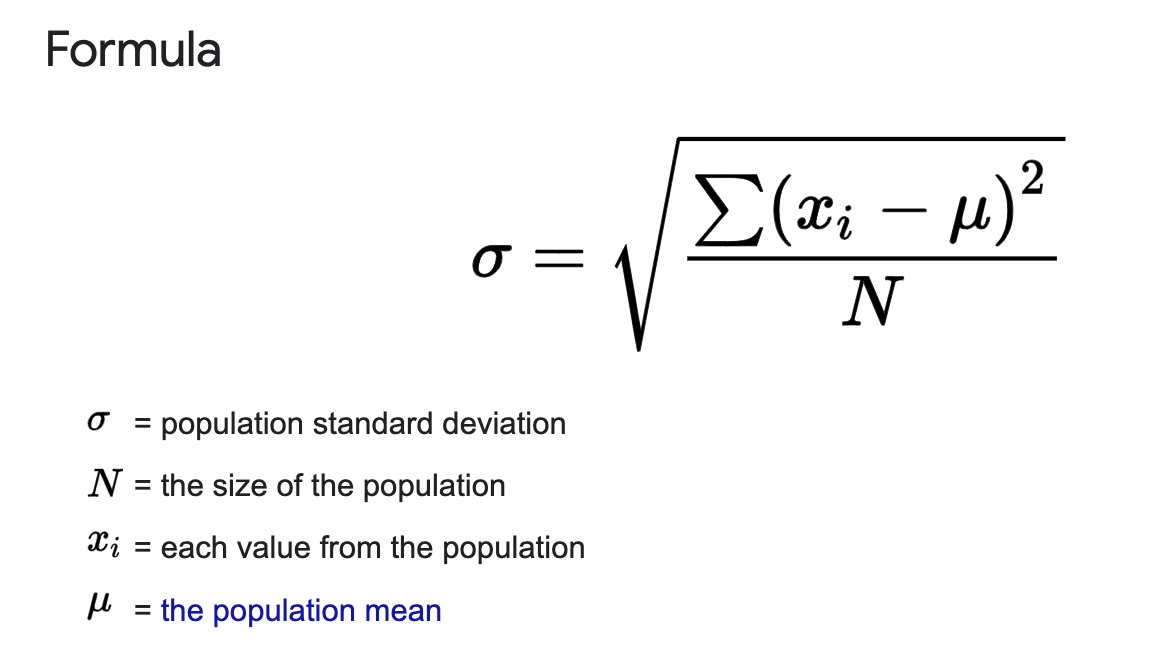
Before we can talk Z-Scores though, we need to talk Standard Deviation (SD).
What's that you say?
Well, a SD is, essentially, the "average distance from the average (mean)" for a set of data points.
What's that you say?
Well, a SD is, essentially, the "average distance from the average (mean)" for a set of data points.
A Z-Score, then, takes each individual point's distance from the mean and compares that to the SD.
So essentially saying, "how does this point's distance from the mean compare to the SD?".
So essentially saying, "how does this point's distance from the mean compare to the SD?".
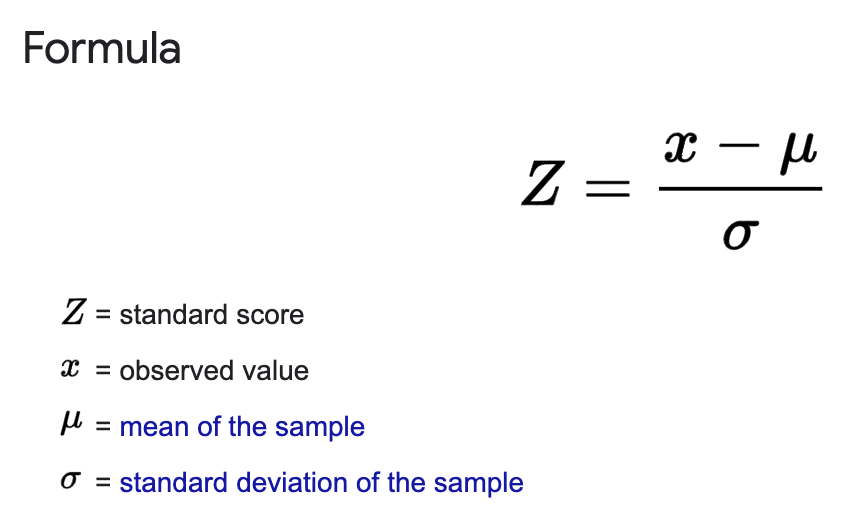
So if a data point has a Z-Score of +2, it means it's 2 SD's above the mean.
And here's why we care.
Especially in the #BTC world. When a data point is really far off from what's "average", we should get curious. Maybe there's some signal there. 😉
And here's why we care.
Especially in the #BTC world. When a data point is really far off from what's "average", we should get curious. Maybe there's some signal there. 😉
Now, generally there are three kinds of Z-Scores we see in the #Bitcoin On-Chain space.
1. Full Data-Set Z-Score
2. Cumulative Z-Score (Expanding)
3. Bollinger Bands (Fixed Lookback Z-Score)
Let's talk about each.
1. Full Data-Set Z-Score
2. Cumulative Z-Score (Expanding)
3. Bollinger Bands (Fixed Lookback Z-Score)
Let's talk about each.
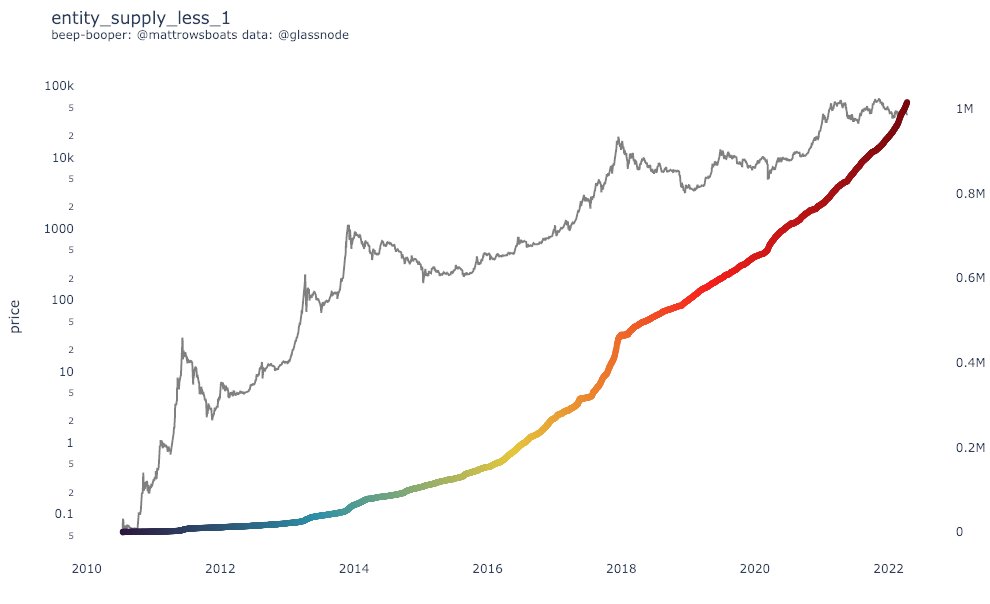
For each of these, we'll look at the data for Supply held by Entities with <1 BTC.
1. So a "Full Data Set Z-Score" is pretty well explained in the name. It uses the entire data set to calculate the SD and then the Z-Score.
I don't see this very often in the #BTC space. Why?
Well, the short answer is the data is real-world data and not very "nice". It's messy.
I don't see this very often in the #BTC space. Why?
Well, the short answer is the data is real-world data and not very "nice". It's messy.
So a Full Data Set Z-Score just doesn't often have "alpha" like folks are looking for. @glassnode doesn't even give this kind of calculation as a possible option in their Workbench.
Here's the Full Data Set Z-Score for our example (Supply held by Entities with <1 #BTC).
Here's the Full Data Set Z-Score for our example (Supply held by Entities with <1 #BTC).
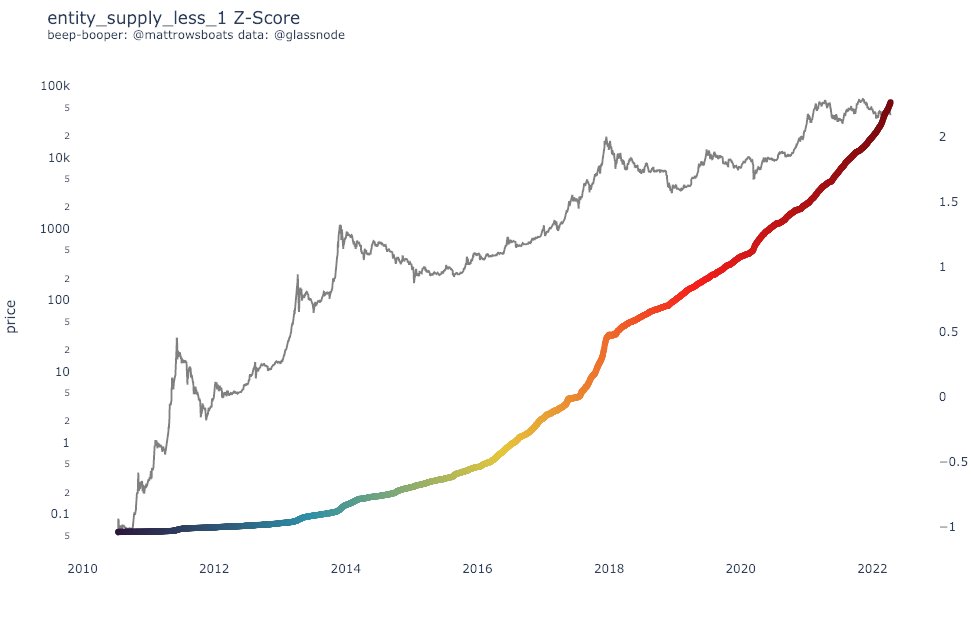
Not much there. And it makes sense. The entire data set just goes up and to the right.
So let's try the 2nd type of Z-Score.
So let's try the 2nd type of Z-Score.
2. A Cumulative or Expanding Z-Score only looks at data points before/up-to the data point being evaluated.
So, for 2017-01-01 for example, only data before that date is used in the calculation. 2017-01-02 includes one additional day, and so-on.
So, for 2017-01-01 for example, only data before that date is used in the calculation. 2017-01-02 includes one additional day, and so-on.
This is often used when amplitudes for data sets in #Bitcoin can be skewed or have higher values earlier on in the history of #BTC.
The Market Realized Gradient Oscillator, for example, uses this kind of Z-Score in its calculation.
checkonchain.com/btconchain/mrk…
The Market Realized Gradient Oscillator, for example, uses this kind of Z-Score in its calculation.
checkonchain.com/btconchain/mrk…
Ok, so for our example, what does a Cumulative Z-Score look like?
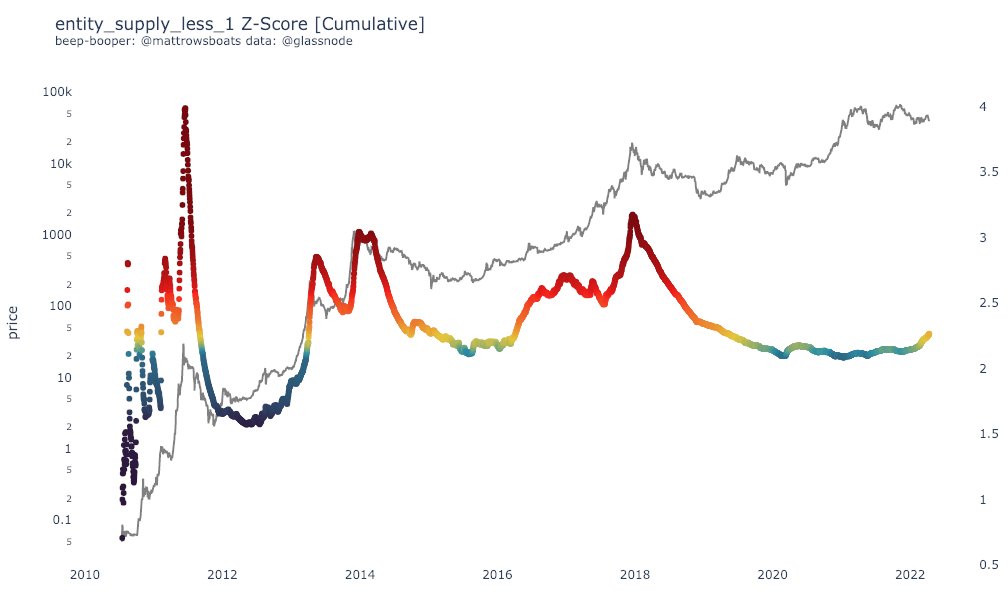
Intrigue! A little bit more intel there. We can see some peaks correlating to peaks in the #Bitcoin price where we couldn't before. Very cool.
On to the 3rd kind of Z-Score.
On to the 3rd kind of Z-Score.
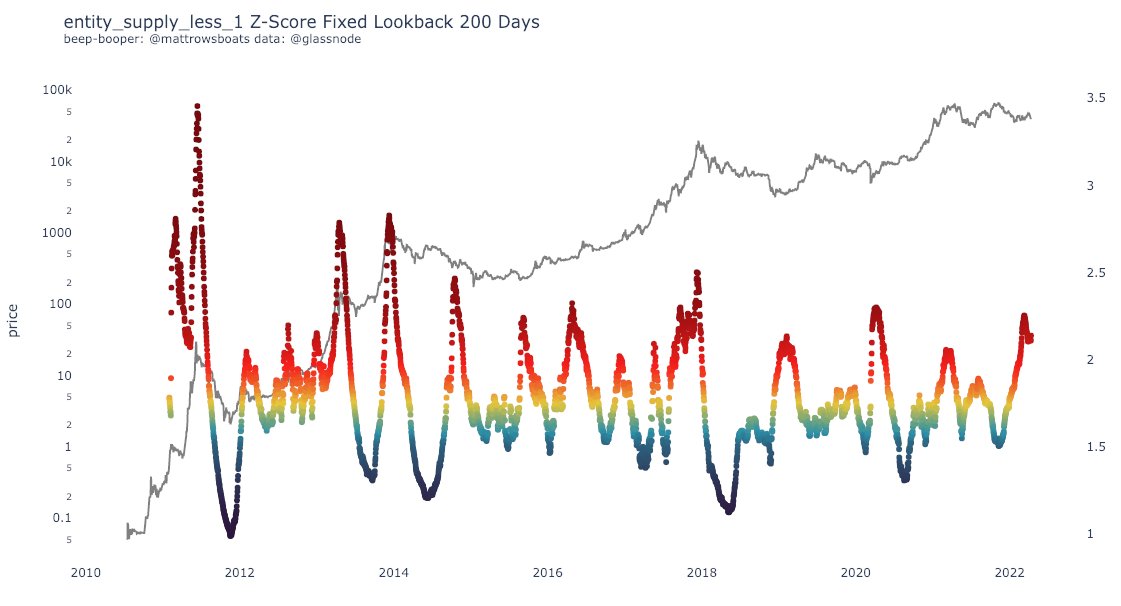
3. Bollinger Bands (Fixed Lookback Z-Scores). If you've been in the charting world at all, you've seen BB's. They are essentially a Fixed Lookback Z-Score.
A Z-Score where you only look back N days from the data point in question.
A Z-Score where you only look back N days from the data point in question.
So with this Z-Score, we're only looking at recent trends. The "lookback" window can vary.
The BB view we are used to seeing is just the Mean and SD's from the mean plotted on a price chart.
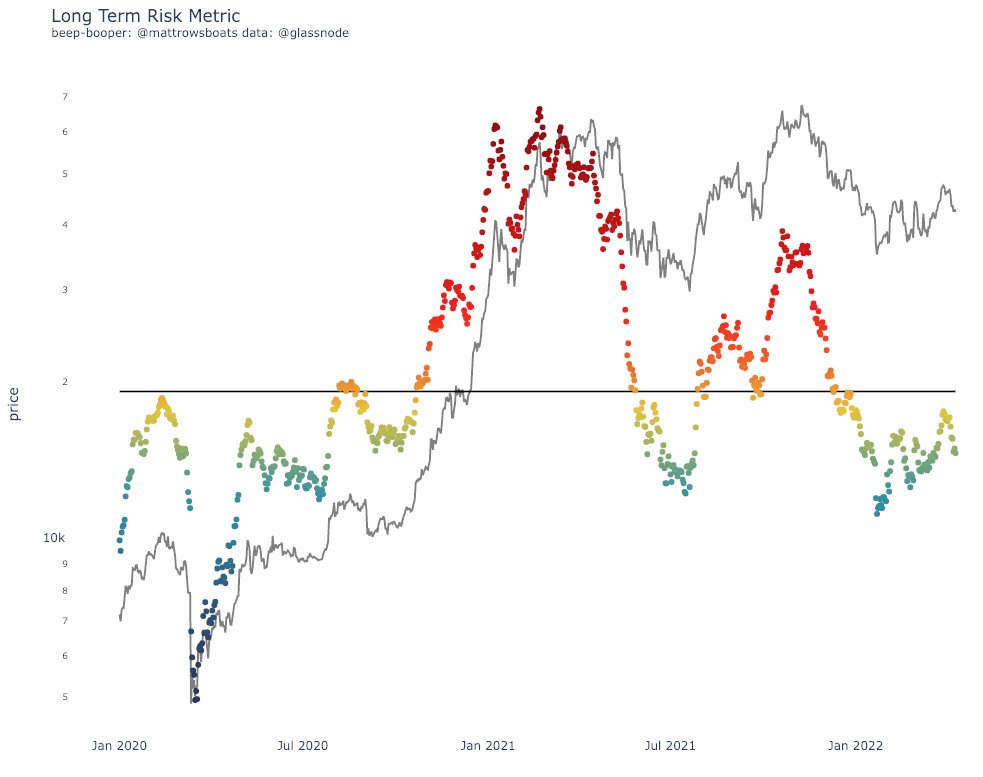
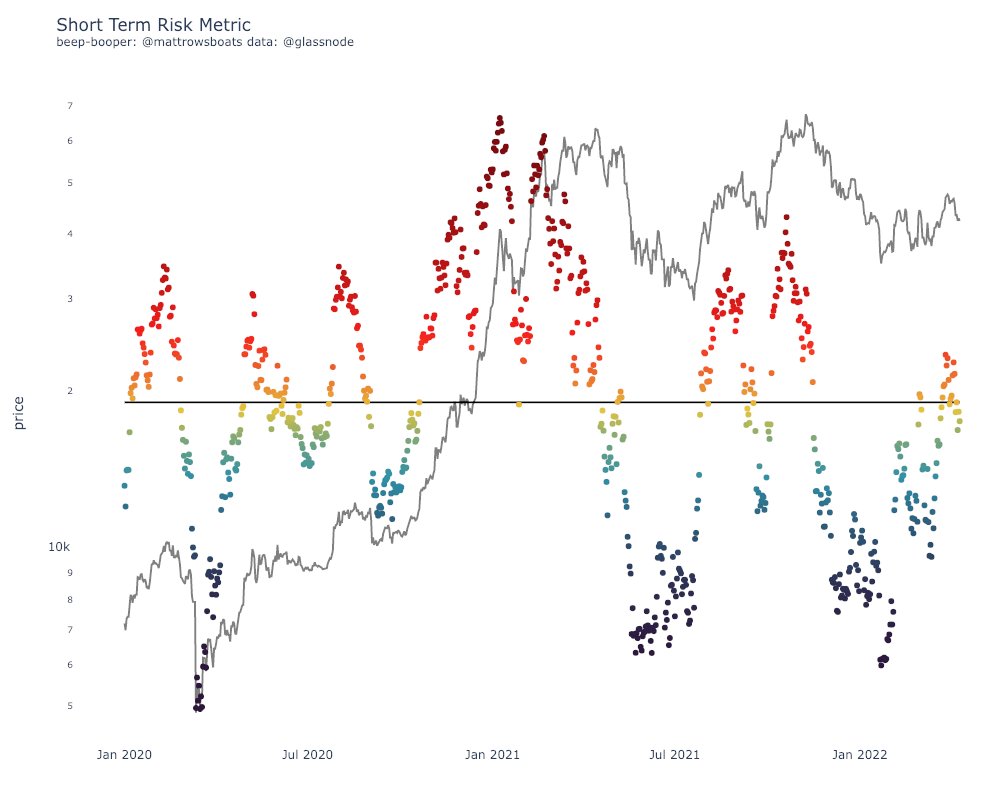
Here's a Fixed Lookback Z-Score for our example, 200 Day Lookback.
The BB view we are used to seeing is just the Mean and SD's from the mean plotted on a price chart.
Here's a Fixed Lookback Z-Score for our example, 200 Day Lookback.
Further intrigue!
So, basically, this Z-Score is only looking at the last 200 Days from each data point. We can see that some of the Red peaks correspond to macro tops, but also macro bottoms. Interesting indeed.
So, basically, this Z-Score is only looking at the last 200 Days from each data point. We can see that some of the Red peaks correspond to macro tops, but also macro bottoms. Interesting indeed.
In general, all these kinds of Z-Scores can help determine if/when something is "deviating from normal".
It's up to the analyst to figure out "why" and if it's actionable intel or not, and how to play or trade it, while also understanding the scope and limitations.
It's up to the analyst to figure out "why" and if it's actionable intel or not, and how to play or trade it, while also understanding the scope and limitations.
Here's a link to a Glassnode Workbench that has equations for the 2nd and 3rd type of Z-Scores we talked about.
studio.glassnode.com/workbench/a203…
studio.glassnode.com/workbench/a203…
Thread inspired by some chats with @TheRealPlanC lately and folks getting curious about the Maths behind the Indicators of the On-Chain world. 👏🏻 🎉.
• • •
Missing some Tweet in this thread? You can try to
force a refresh