#Nifty Vs #DowJones Who will Lead?

As promised here I am posting my analysis in this thread

1. Dow & Nifty 2004 to 2006. Dow Went into sideways consolidation n did 10% move where as Nifty gave a stunning 300% move in this period. Image
2. What was the reason behind Nifty's such a stellar move during 2004-2006? Here is the clue.

Ratio chart gave a breakout in 2004 suggesting outperformance by Nifty against Dow. Index moved from 1300 to 4245,up by 300% whereas Dow remained in Range 9700-11700 during 2004-06 Image
3. What happened during 2009-2022 ? Both indices moving in tandem. Infact Dow Jones relatively performed little better than Nifty during this period. Image
4. RS Chart Nifty Vs DowJones during 2009-2021/22

It remained in consolidation phase for more than a decade before giving breakout in September 2021 Image
5. Current setup Indicating Nifty likely to outperform Dow Jones in coming years by Big margin. Early breakout in September 2021 n the current RS Chart indicating we are ready for outperformance in 2-3 years Image
6. Dow outperformed Nifty during 1997-2003 phase Even RS Charts suggested this underperformance/sideways move by Nifty during this period except that July 1999 to February 2000 spike which faded away quickly ImageImage
7. Summary:Based on RS charts Dow is likely to reamain sideways/underperform Nifty. Indian markets to go up BIG time in next couple of yrs as suggested by RS charts. 2022-2025 can be India's Time. Make ur bets based on ur Research/Risk

This is my view based on RS Charts/history
8. Right now Dow Jones is 2-2.5% above recent low 32272 where as Nifty is 9% above recent low 15670 showing outperformance by Nifty during this fall.

Time to decouple and outperform. Its just a matter of few weeks.

#NiftyvsDow

• • •

Missing some Tweet in this thread? You can try to force a refresh
 

Keep Current with Shivaji Vitthalrao🇮🇳

Shivaji Vitthalrao🇮🇳 Profile picture

Stay in touch and get notified when new unrolls are available from this author!

Read all threads

This Thread may be Removed Anytime!

PDF

Twitter may remove this content at anytime! Save it as PDF for later use!

Try unrolling a thread yourself!

how to unroll video
  1. Follow @ThreadReaderApp to mention us!

  2. From a Twitter thread mention us with a keyword "unroll"
@threadreaderapp unroll

Practice here first or read more on our help page!

More from @shivaji_1983

Feb 26, 2021
NTPC has potential to test 250-300 or even 400 in next 3-4 years.

13 years of consolidation. CMP 107+

Close above 145-150 will trigger the multi year bull market in this stock.

Stock has given breakout on weekly closing basis.

Disc: Holding the stock from 106 levels
Stock No.2

NMDC - 8-9 years of consolidation.

Stock has potential to touch 300 and then 500 levels in 3-4 years.

Close above 140 can trigger that move. CMP 127.

Disc: Holding this stock from 125+ levels
Stock No. 3

BHEL - Coming out of 6 years downtrend.

Gave breakout above 44-45 after 11 months of consolidation which is very significant bottom

Stock can do 128 and 200 in next 3-4 years

Disc: Invested from 41+ levels
Read 4 tweets
Feb 22, 2021
Nifty Sectors

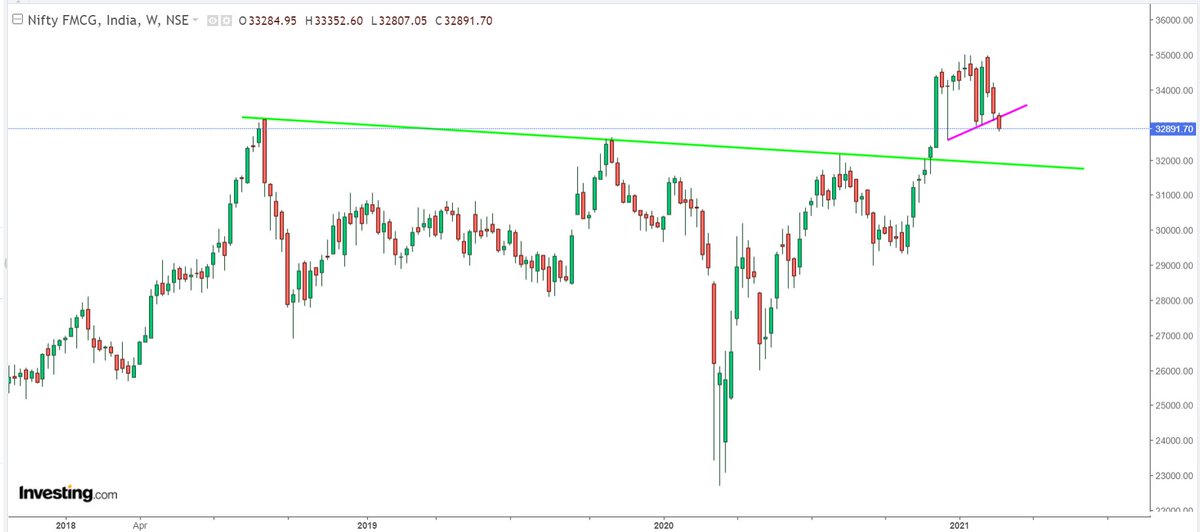
1. Nifty FMCG - Breakdown can test 31850 green line
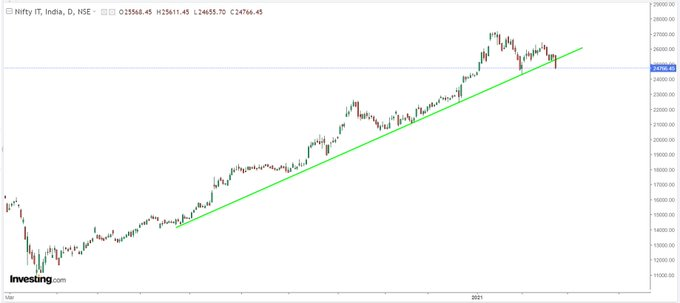
2. Nifty IT - Below 24300 momentum on downside
Nifty Pharma - Serious breakdown can do 10800
Read 5 tweets
Feb 19, 2021
1 observation made on Index since feb 2014 which I will reveal to limited people. 😀👍

#Secret 😁😁😉😉

Please do not DM me😀🙏🙏
Nifty Observation

1. Since 2014 all rallies lasted for either 6 or 13 months pattern.

2. Current rally if repeats history expect good correction from 23rd March or 6th April 2021(13th Month)

3. All the rallies retraced 38-50% of previous move in 2-3 months Image
4. Except 2015-16 fall (9119-6825) which took more time to correct rest all the falls are done in 2-3 months

5. 13 is a fibo number. Expect either new high or lower top formation. Let the market decide it. Strength of next upmove will decide the next big move in markets
Read 6 tweets
Sep 23, 2020
Nifty Analysis

1. Dow theory considers only closing price

2. Since March 2020 index making Higher top and higher bottom pattern.

3. Last major bottom was at 10880
mini bottoms at 11,110 and 11,185 which were breached in last 2 days. Indicates short term down trend Image
4. Last top was at 11794 and then at 11618.
Previous bottoms 11,100 and 11185 were broken yesterday as shown by green lines.

5. Till last major bottom 10,880 is not broken, we may not see major downside.

6. Index dint close below 11100 though intraday price went till 11,020+ Image
7. As long as price is above 10,880 major bottom it may go into sideways. only a close below 10880 can give more downside targets.

8. After rally from 7500 to 11800 index at times goes into sideways if major bottom is not broken. Break below that confirms medium term down trend Image
Read 27 tweets

Did Thread Reader help you today?

Support us! We are indie developers!


This site is made by just two indie developers on a laptop doing marketing, support and development! Read more about the story.

Become a Premium Member ($3/month or $30/year) and get exclusive features!

Become Premium

Don't want to be a Premium member but still want to support us?

Make a small donation by buying us coffee ($5) or help with server cost ($10)

Donate via Paypal

Or Donate anonymously using crypto!

Ethereum

0xfe58350B80634f60Fa6Dc149a72b4DFbc17D341E copy

Bitcoin

3ATGMxNzCUFzxpMCHL5sWSt4DVtS8UqXpi copy

Thank you for your support!

Follow Us on Twitter!

:(