Visual financial astrology update for $ETH & $BTC #Bitcoin #Cryptos
Showing planets in tropical zodiac signs in color with #Tableau, a unique #Datavisualization
Thread >
Saturn
Sign change in 2017 2 days from BTC top
Saturn in Aquarius (light gray) supporting cryptos
Showing planets in tropical zodiac signs in color with #Tableau, a unique #Datavisualization
Thread >
Saturn
Sign change in 2017 2 days from BTC top
Saturn in Aquarius (light gray) supporting cryptos

Jupiter
Jupiter sign change May 2021 2 days from ETH major top
Jupiter in Aquarius (light gray) supported cryptos
Jupiter in Pisces (purple) weaker
Into Aries (red) this coming week! Should be a + for risk but still watching asset classes to see what responds.
Jupiter sign change May 2021 2 days from ETH major top
Jupiter in Aquarius (light gray) supported cryptos
Jupiter in Pisces (purple) weaker
Into Aries (red) this coming week! Should be a + for risk but still watching asset classes to see what responds.

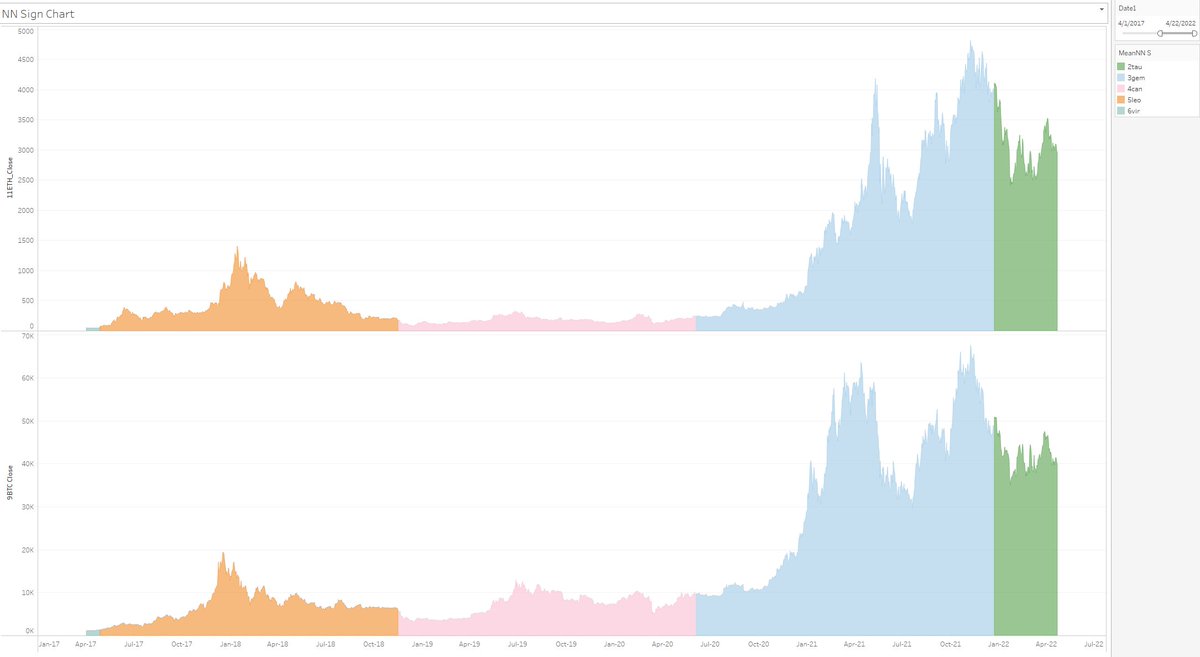
North Node / NN
North node in Leo (gold) crypto rally, but not entire way
In Cancer (pink), bear market
In Gemini (light blue), rally again
In Taurus (green), weaker
Astro basics masculine / feminine signs
North node in Leo (gold) crypto rally, but not entire way
In Cancer (pink), bear market
In Gemini (light blue), rally again
In Taurus (green), weaker
Astro basics masculine / feminine signs

Mars
Mars sign change into Capricorn (dark gray) at low of year (also key low on indexes)
Mars in Aquarius (light gray) helped recent rally
Mars in Pisces (purple) weaker again
In Aries should help
Mars sign change into Capricorn (dark gray) at low of year (also key low on indexes)
Mars in Aquarius (light gray) helped recent rally
Mars in Pisces (purple) weaker again
In Aries should help

Sun
Sun in Aries (red) recently stronger
Sun in Taurus (green) weaker - "additional risk with eclipses in this sign" same words 23-April
Sun in Aries (red) recently stronger
Sun in Taurus (green) weaker - "additional risk with eclipses in this sign" same words 23-April

Venus
Venus in Capricorn (dark gray) Nov-2021 near major top
Venus in Aquarius (light gray) helped rally
Venus in Pisces (purple) weaker again
Venus in Aries (red) tried to lift but failing so far - think she needs some help from other planets
Venus in Capricorn (dark gray) Nov-2021 near major top
Venus in Aquarius (light gray) helped rally
Venus in Pisces (purple) weaker again
Venus in Aries (red) tried to lift but failing so far - think she needs some help from other planets

Mercury
Mercury in Taurus (green) was weaker; will Rx back into this sign in coming weeks
More frequent changes here, not all produce turn, but some changes of character
Mercury in Taurus (green) was weaker; will Rx back into this sign in coming weeks
More frequent changes here, not all produce turn, but some changes of character

Mercury Motion
Blue = normal direct motion
Orange = slow under 1' per day
Red = Rx apparent retrograde motion
Several turns - already slow & Rx period coming up
These tend to be more bearish in bear environments
Blue = normal direct motion
Orange = slow under 1' per day
Red = Rx apparent retrograde motion
Several turns - already slow & Rx period coming up
These tend to be more bearish in bear environments

• • •
Missing some Tweet in this thread? You can try to
force a refresh


