
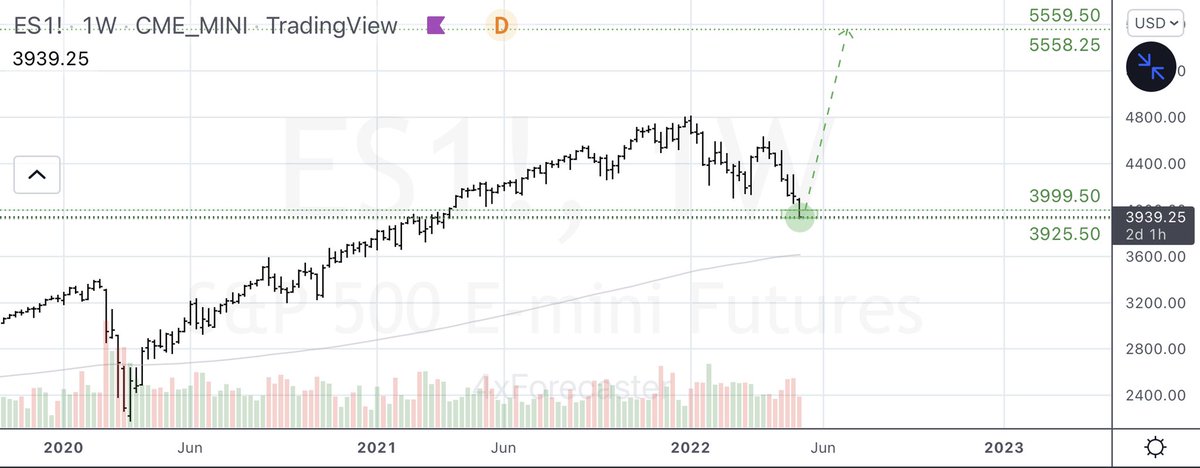
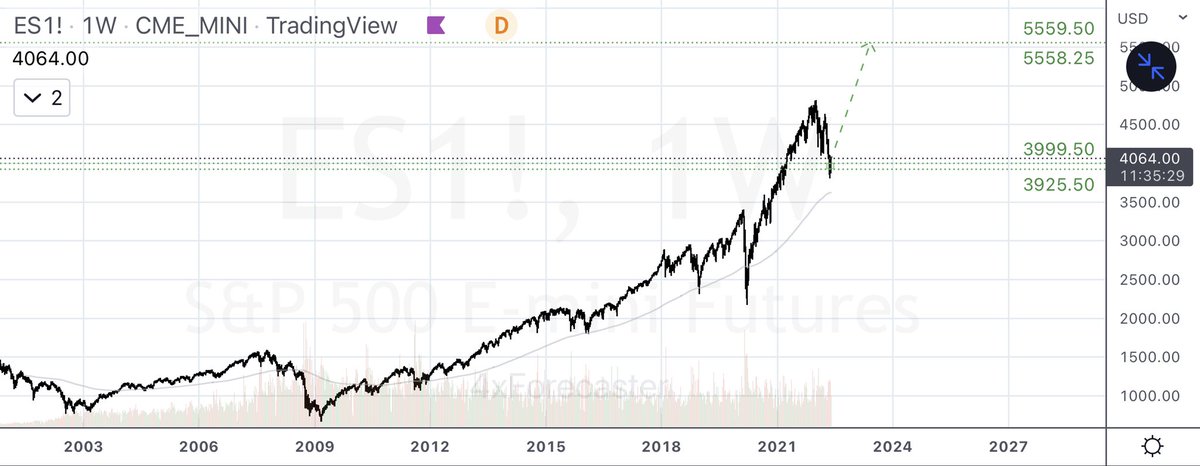
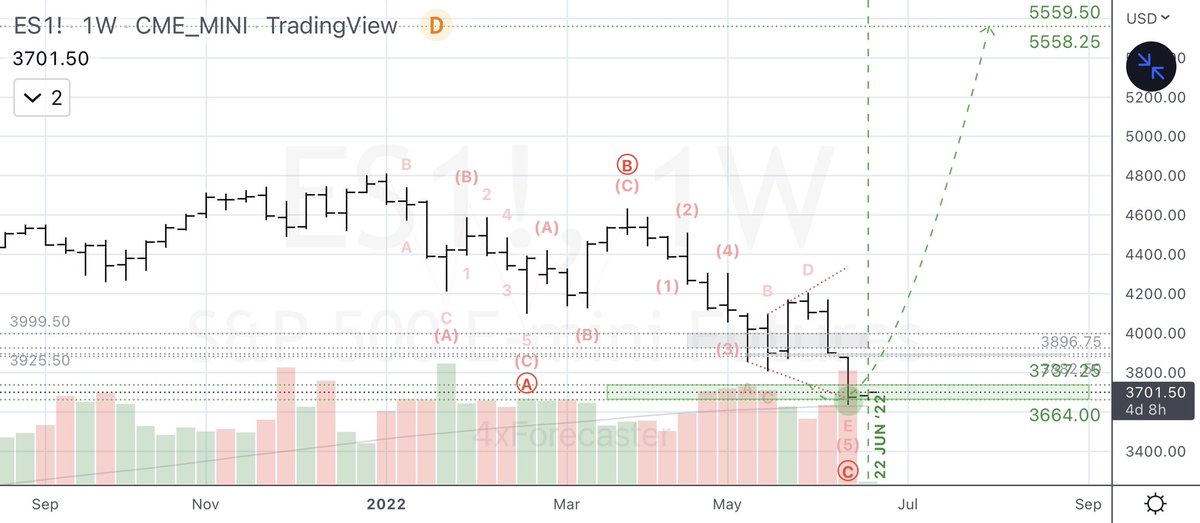
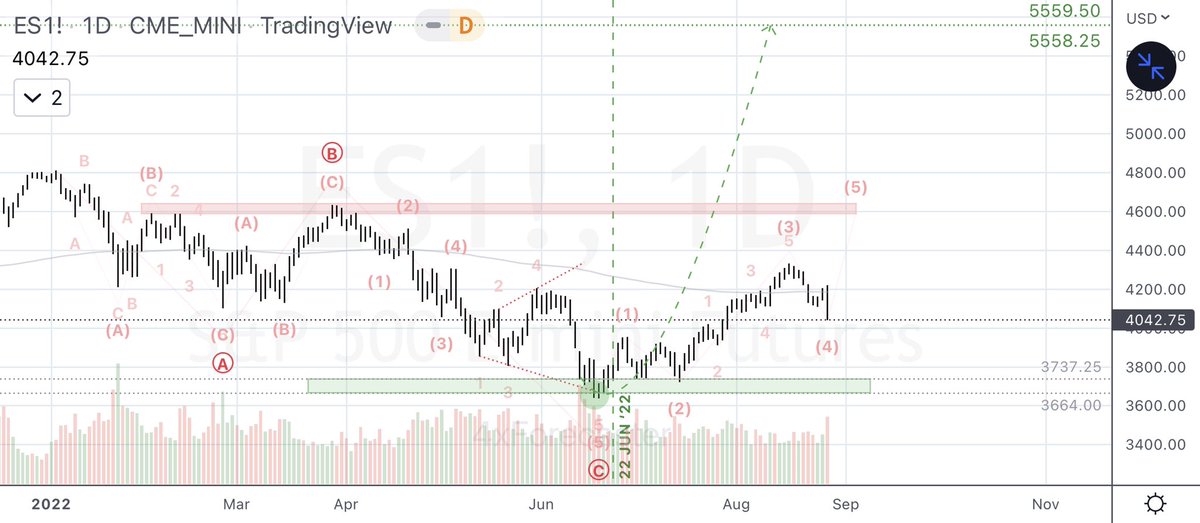
$ES (S&P-500 e-Mini Futures):
- ST: Model eyes high-probability reversal at 3999.50/3925.50 range
- MT: Bullish pending reversal sequence validation; if true, Model eyes narrow 5558.25/5559.50 target range
- LT: Bearish
#SP500
- ST: Model eyes high-probability reversal at 3999.50/3925.50 range
- MT: Bullish pending reversal sequence validation; if true, Model eyes narrow 5558.25/5559.50 target range
- LT: Bearish
#SP500


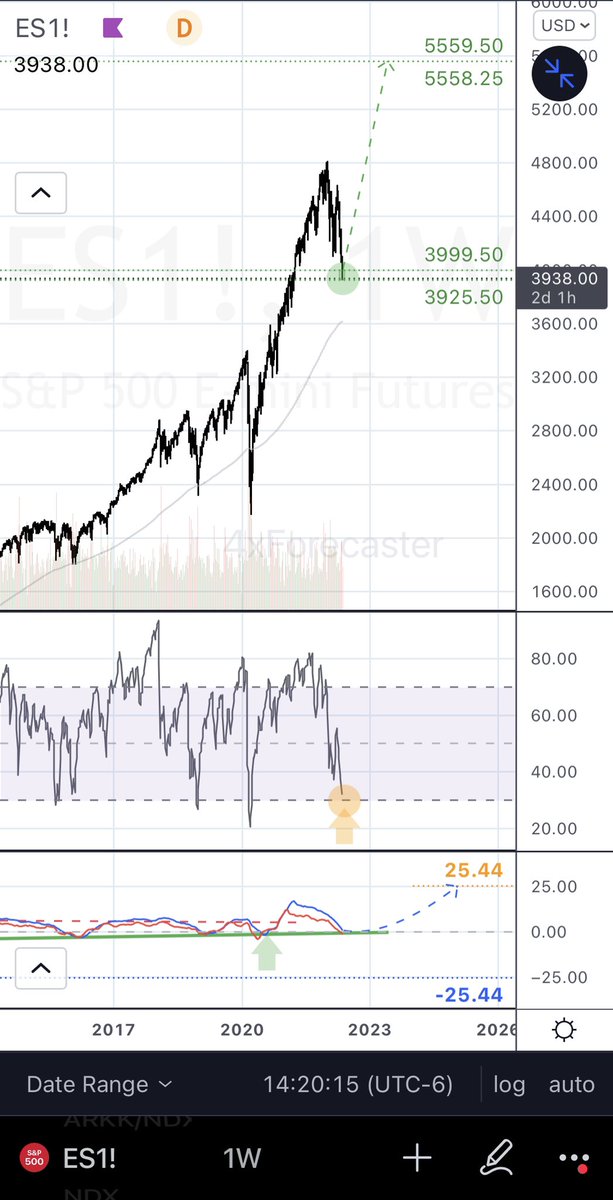
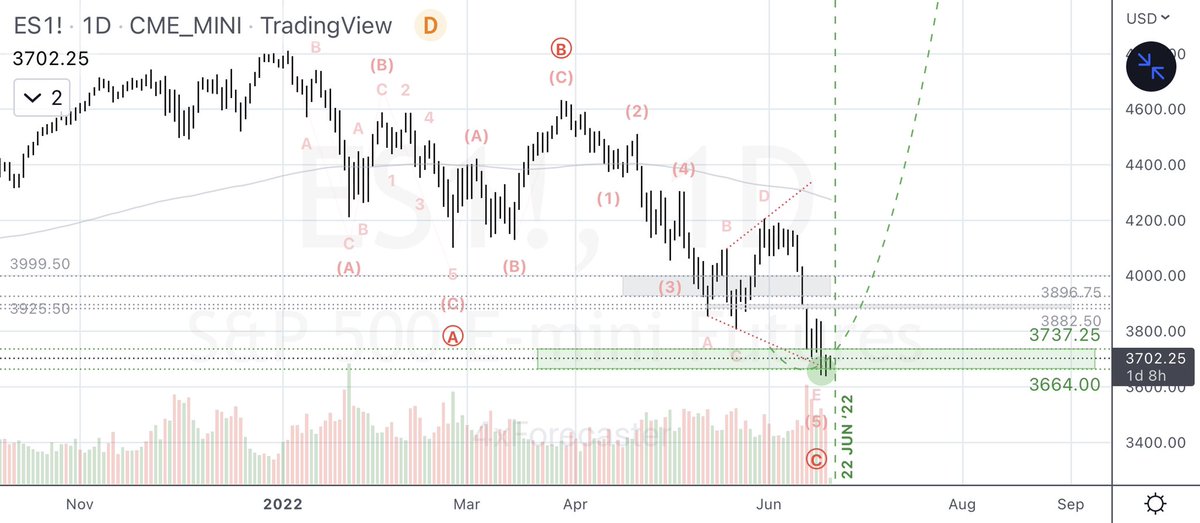
$ES (S&P 500 e-Mini Futs):
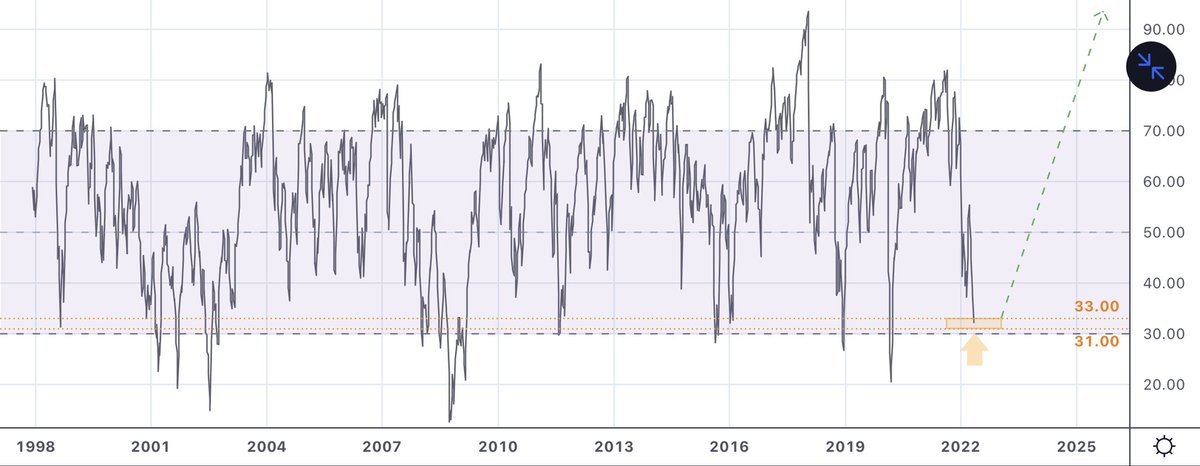
- ST: Fell, hit 3999.50/3925.50 target range as forecast; RSI in reversal range; Model is bullish, nears reversal
- MT: Bullish; unchanged target at 5558.25/5559.50
- LT: Bearish
- ST: Fell, hit 3999.50/3925.50 target range as forecast; RSI in reversal range; Model is bullish, nears reversal
- MT: Bullish; unchanged target at 5558.25/5559.50
- LT: Bearish


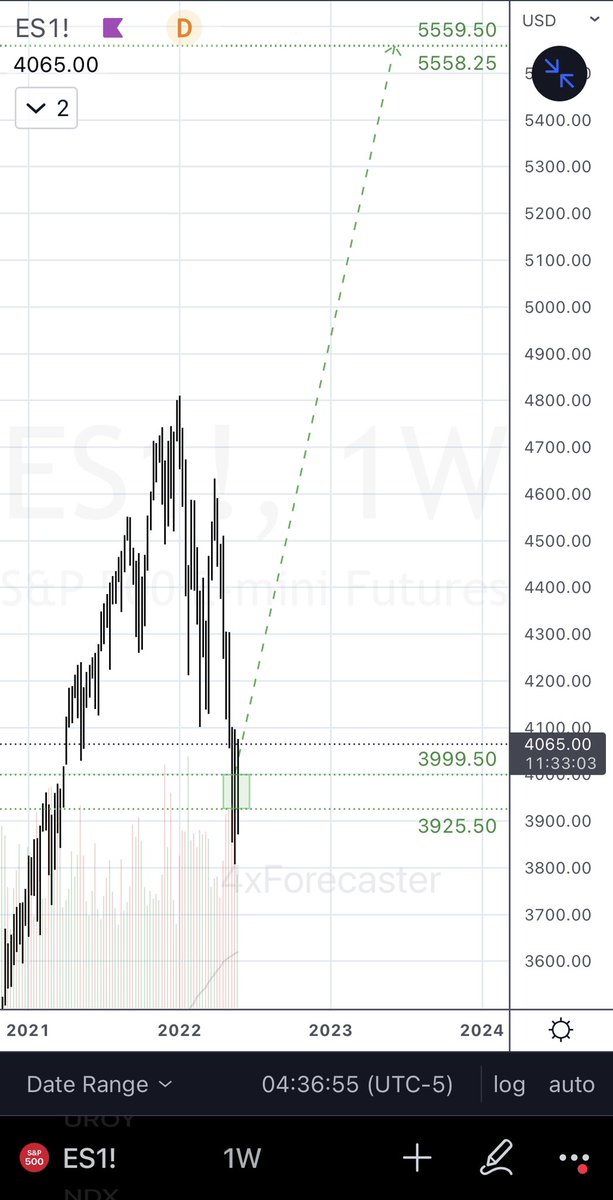
$ES:
ST/MT: unchanged forecast (thread)
ST/MT: unchanged forecast (thread)
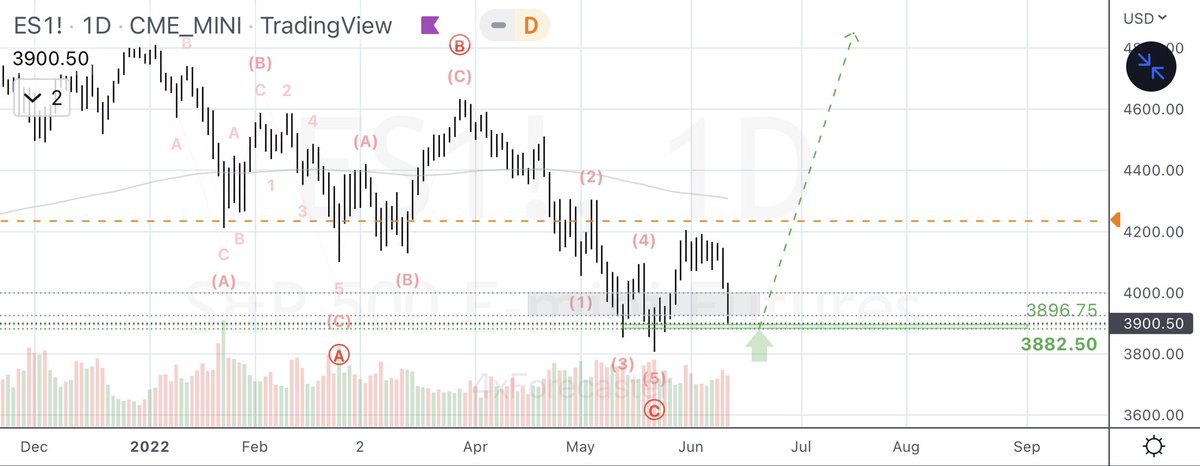
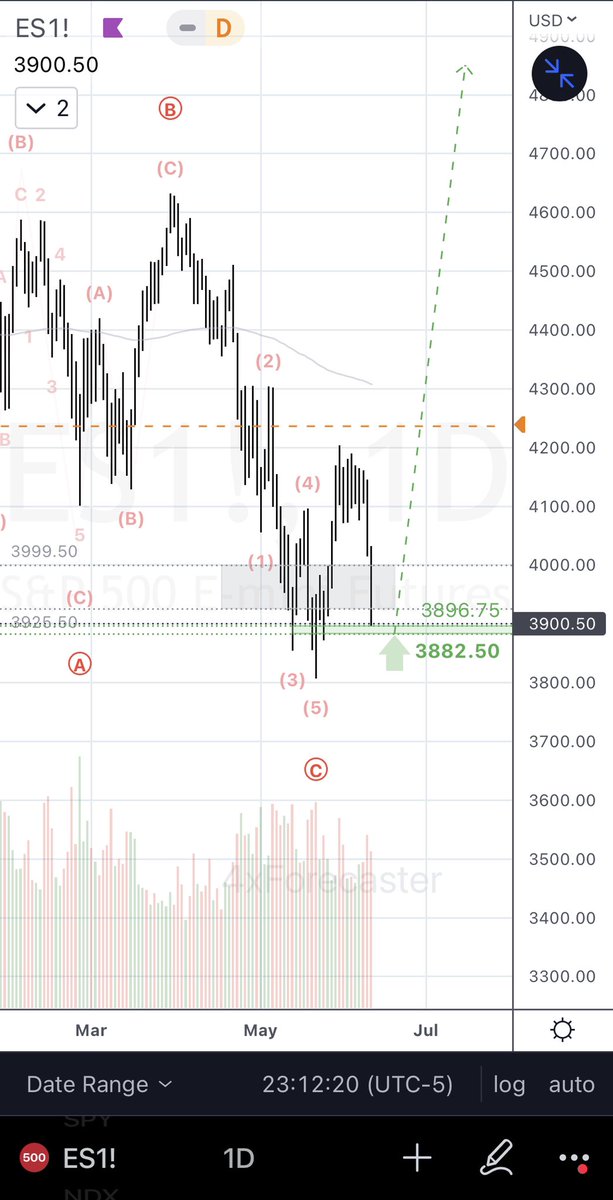
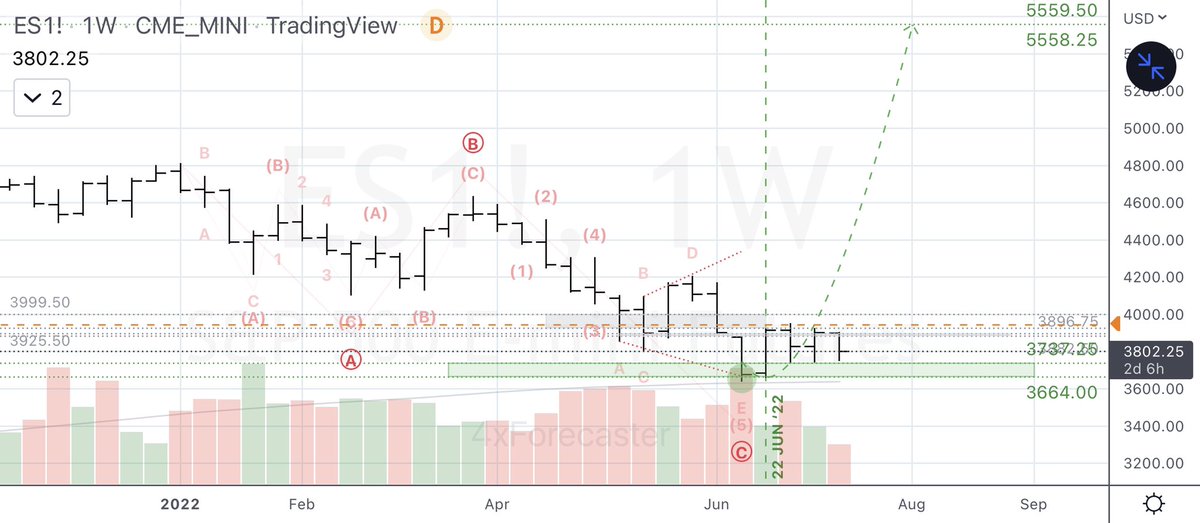
$ES (S&P-500 e-Mini Futures):
- ST: high-probability reversal at 3896.75/3882.50 target range; 3882.50 favored; invalidated if breaks below wave-C⃝ = 3807.50
#SP500 $SPY #ES1
- ST: high-probability reversal at 3896.75/3882.50 target range; 3882.50 favored; invalidated if breaks below wave-C⃝ = 3807.50
#SP500 $SPY #ES1
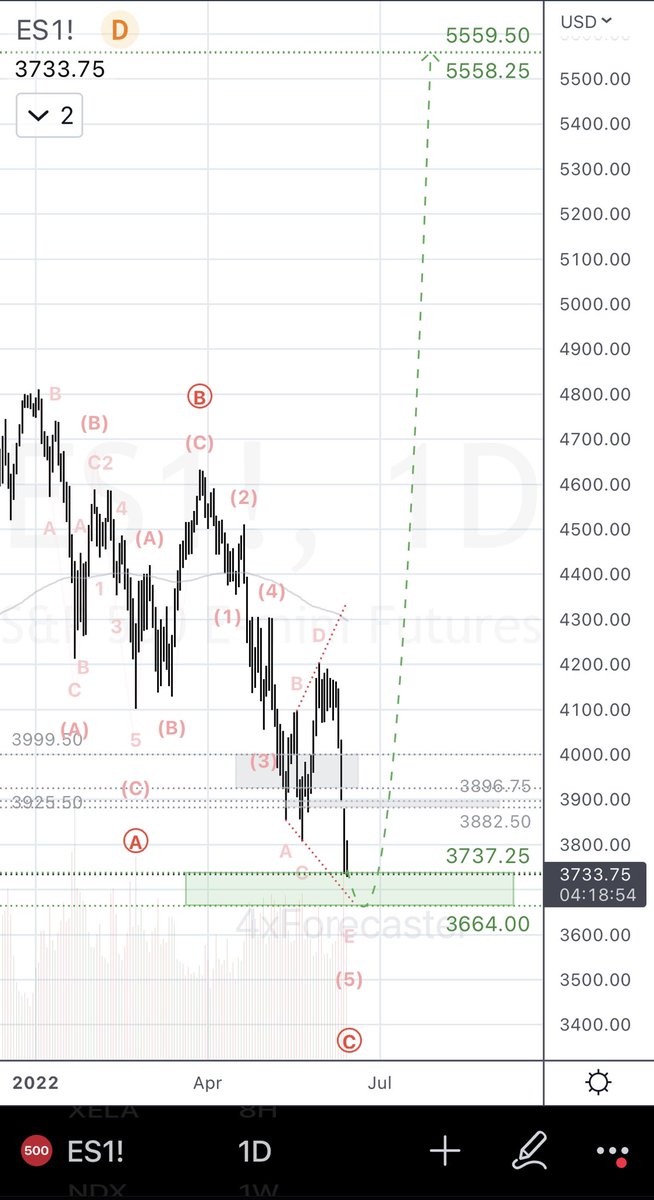
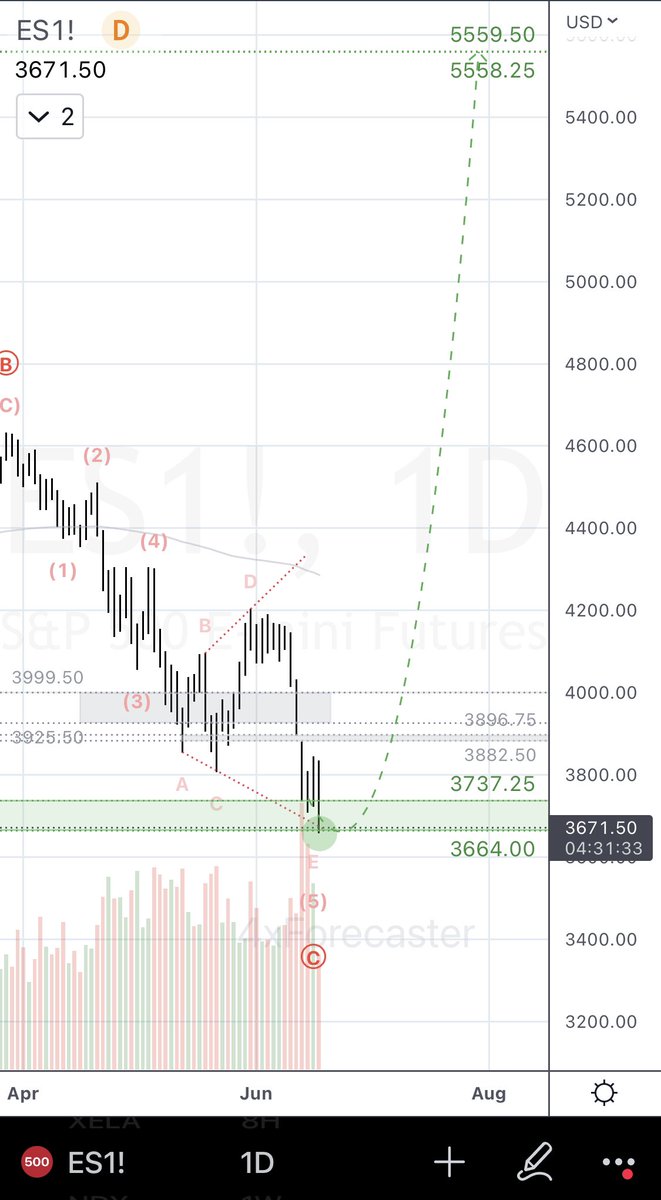
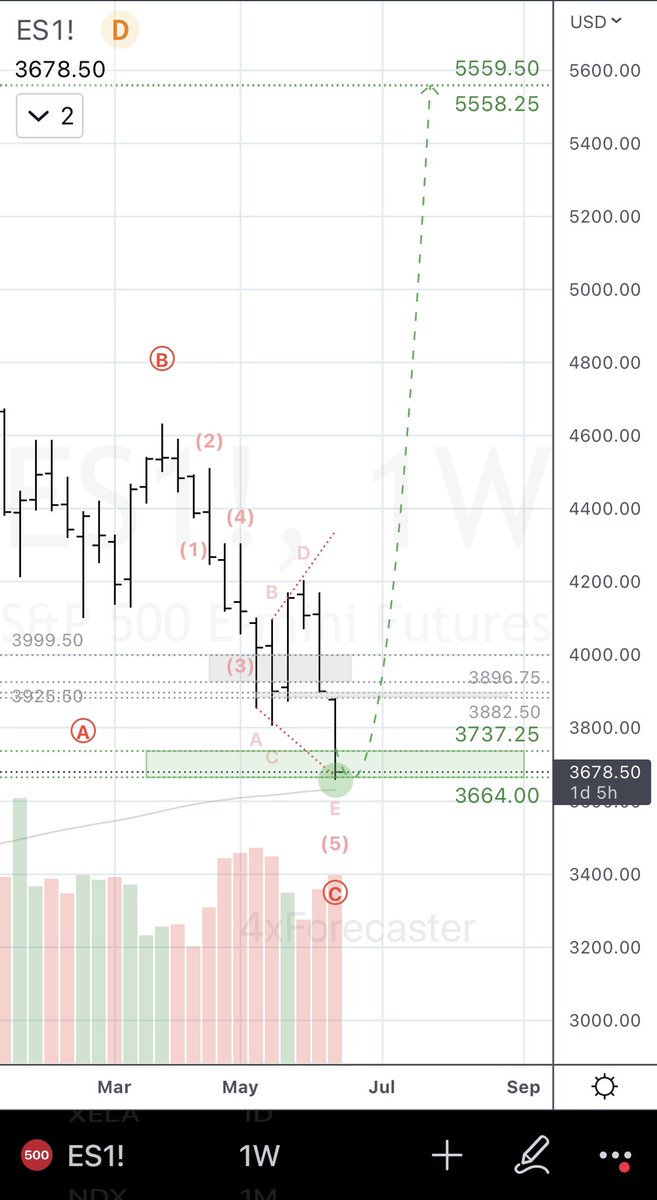
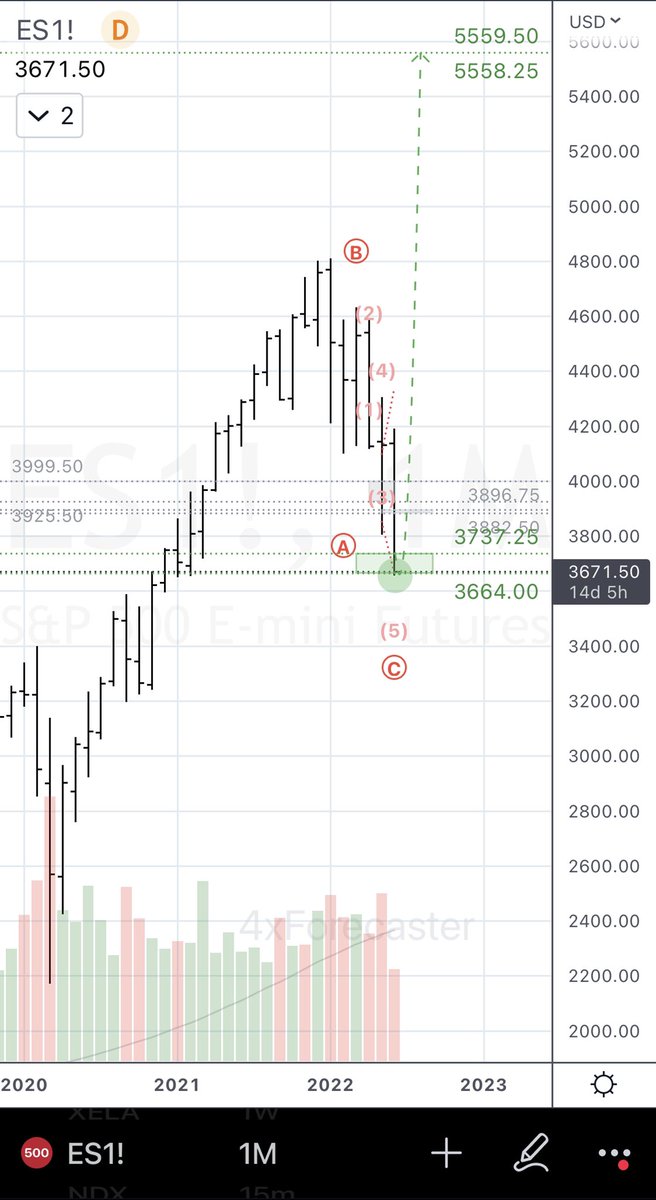
$ES (S&P-500 e-Mini Futures):
Note: wide swings, esp. those shaping into geometries are hard to pin. Their core symmetry = future R/S level:
- ST: significant swings completing into terminal geometry (A-B-C-D-E) at wave-C⃝ = 3737.25/3664.50
- MT: bullish
#SP500 #ES1 #SPX #SPY
Note: wide swings, esp. those shaping into geometries are hard to pin. Their core symmetry = future R/S level:
- ST: significant swings completing into terminal geometry (A-B-C-D-E) at wave-C⃝ = 3737.25/3664.50
- MT: bullish
#SP500 #ES1 #SPX #SPY
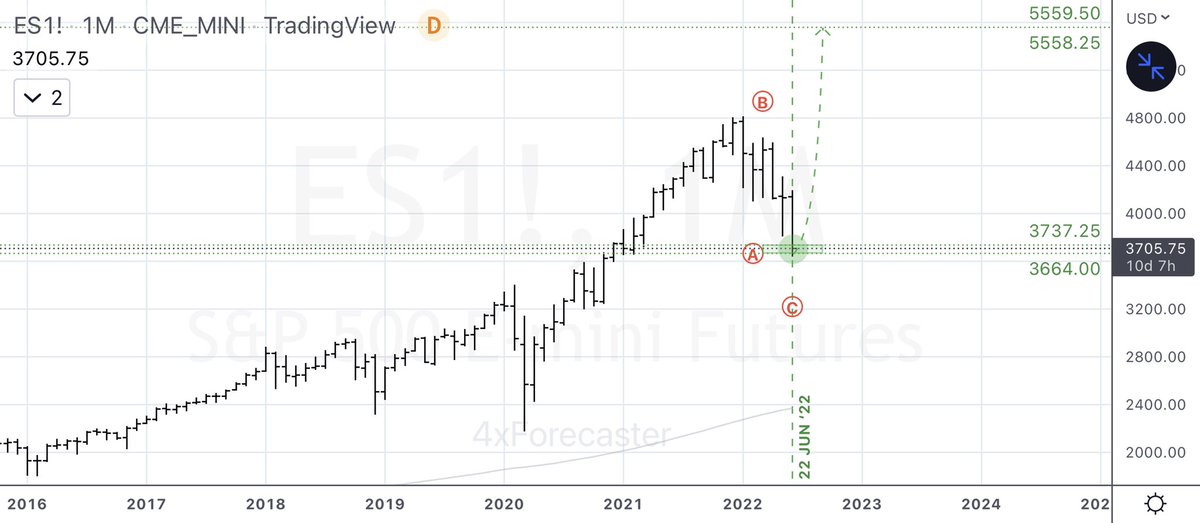
$ES (S&P-500 e-Mini Futures):
Target HIT (in its entirety)
- No change in MT forecast (see thread; charts for context)
#SP500 #ES1 #SPX #SPY
Target HIT (in its entirety)
- No change in MT forecast (see thread; charts for context)
#SP500 #ES1 #SPX #SPY
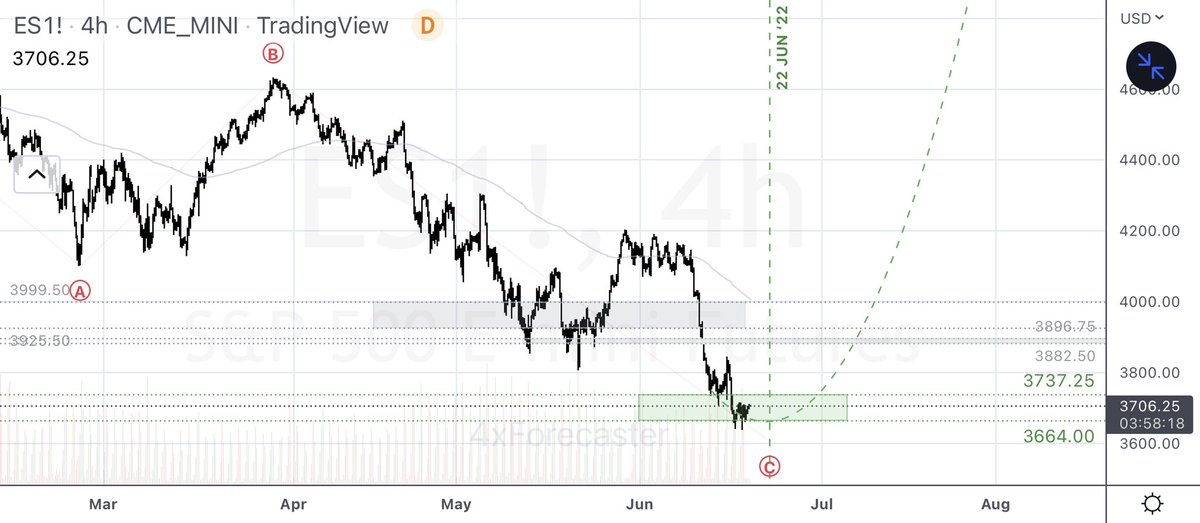
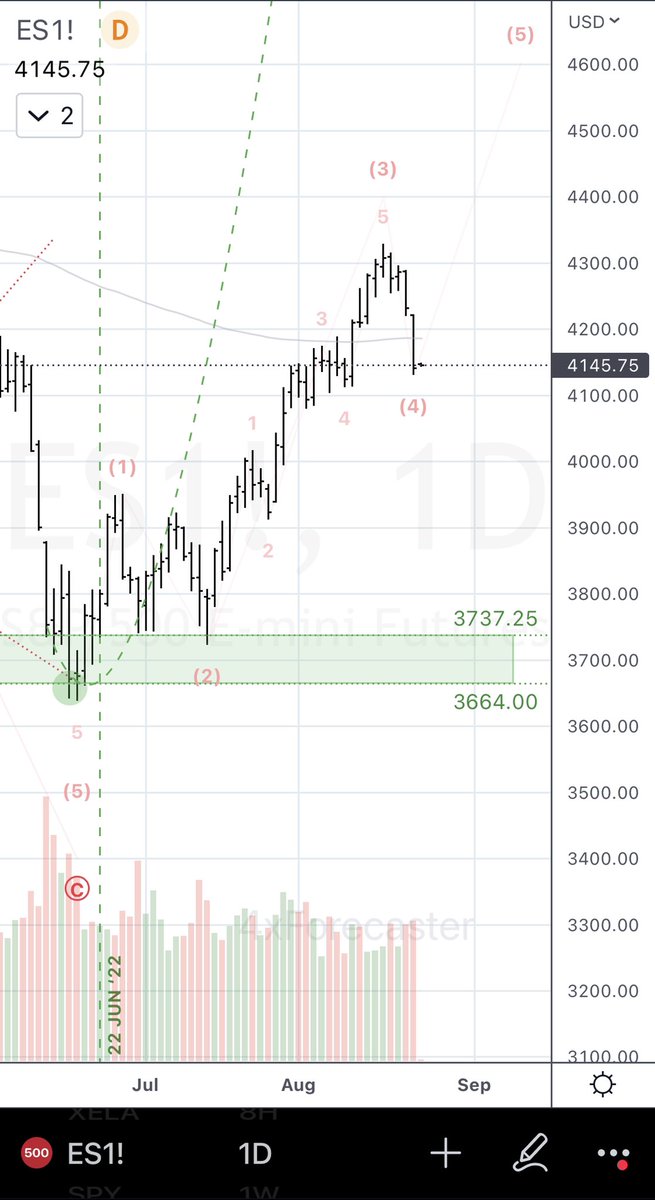
$ES (S&P-500 e-Mini Futures):
Still moving as forecast (see thread above)
- ST: bullish; 22 JUN timing carved support at 3735.00 low (daily chart)
- MT: bullish; still eyeing 5558.25/5559.50 bearish reversal target
- ST: bearish
#SP500 #ES1 #SPX #SPY
Still moving as forecast (see thread above)
- ST: bullish; 22 JUN timing carved support at 3735.00 low (daily chart)
- MT: bullish; still eyeing 5558.25/5559.50 bearish reversal target
- ST: bearish
#SP500 #ES1 #SPX #SPY
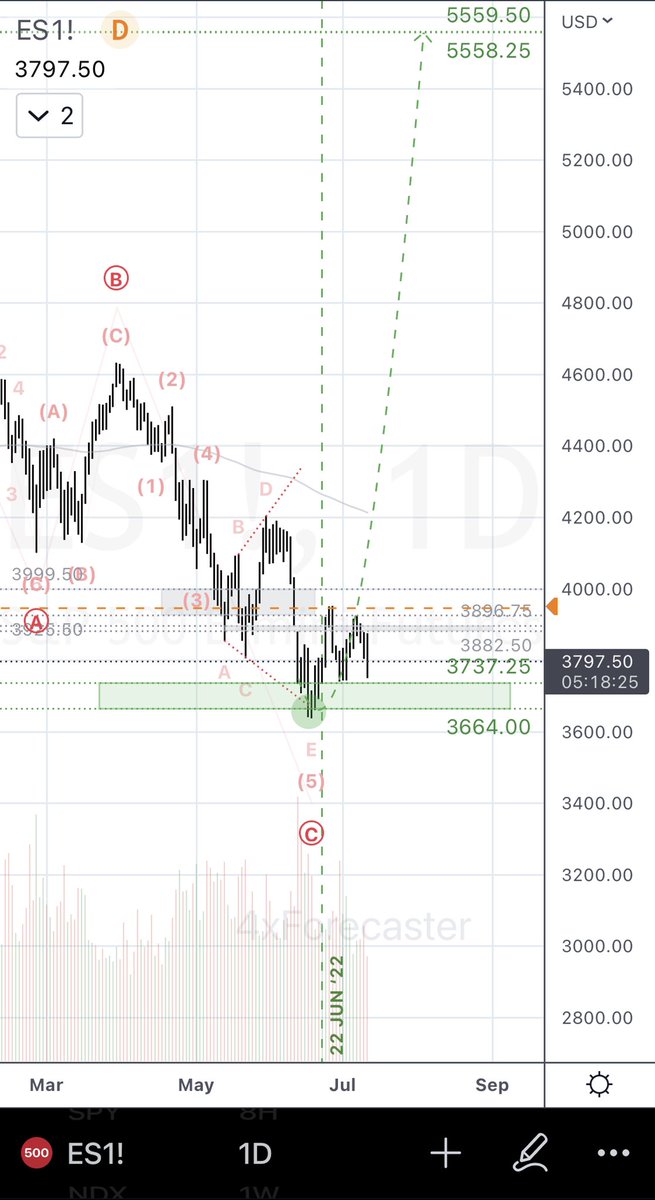
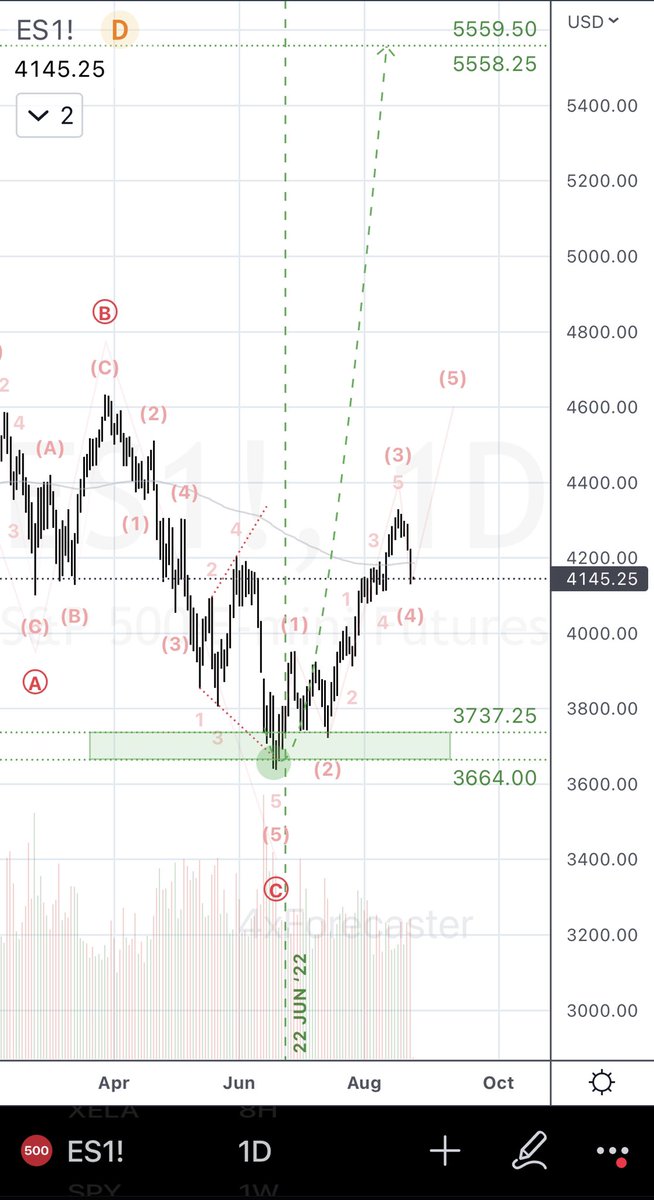
$ES (S&P-500 e-Mini Futures):
- ST: bullish; still moving as forecast (see thread)
- MT: bullish; interim resistance circa 4600.00; still eyeing 5558.25/5559.50 bearish reversal target
- ST: bearish
#SP500 #ES1 #SPX #SPY
- ST: bullish; still moving as forecast (see thread)
- MT: bullish; interim resistance circa 4600.00; still eyeing 5558.25/5559.50 bearish reversal target
- ST: bearish
#SP500 #ES1 #SPX #SPY
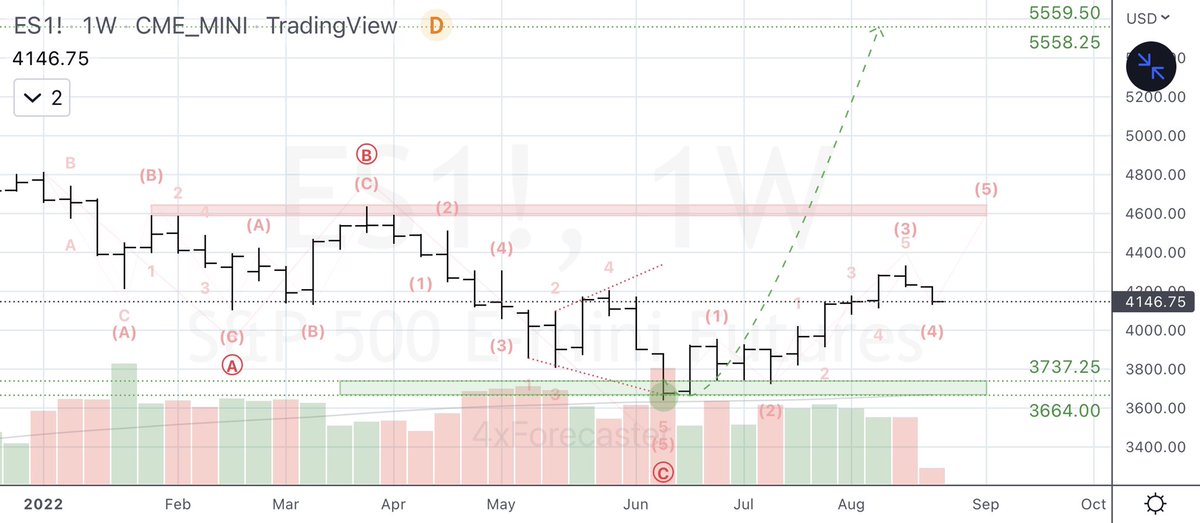
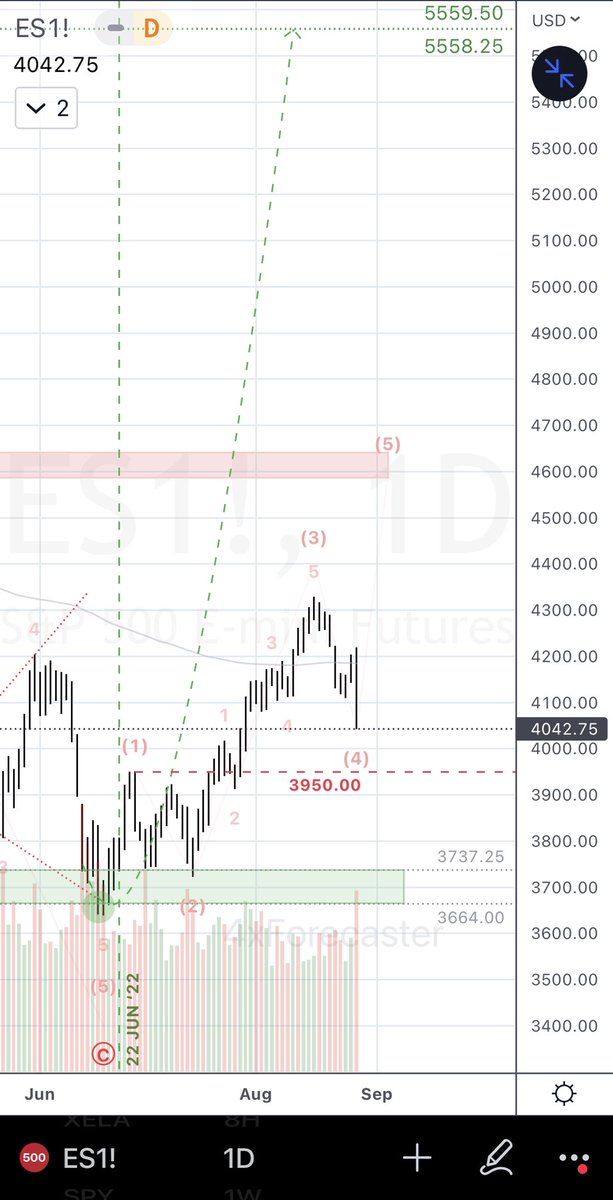
$ES (S&P-500 e-Mini Futures):
- ST: wave-(4) correction likely over; for overall bullish impulse to remain valid, it must remain > 3950.00
- MT: bullish; interim resistance circa 4600.00; still eyeing 5558.25/5559.50 bearish reversal target
- LT: bearish
#SP500 #ES1 #SPX #SPY
- ST: wave-(4) correction likely over; for overall bullish impulse to remain valid, it must remain > 3950.00
- MT: bullish; interim resistance circa 4600.00; still eyeing 5558.25/5559.50 bearish reversal target
- LT: bearish
#SP500 #ES1 #SPX #SPY
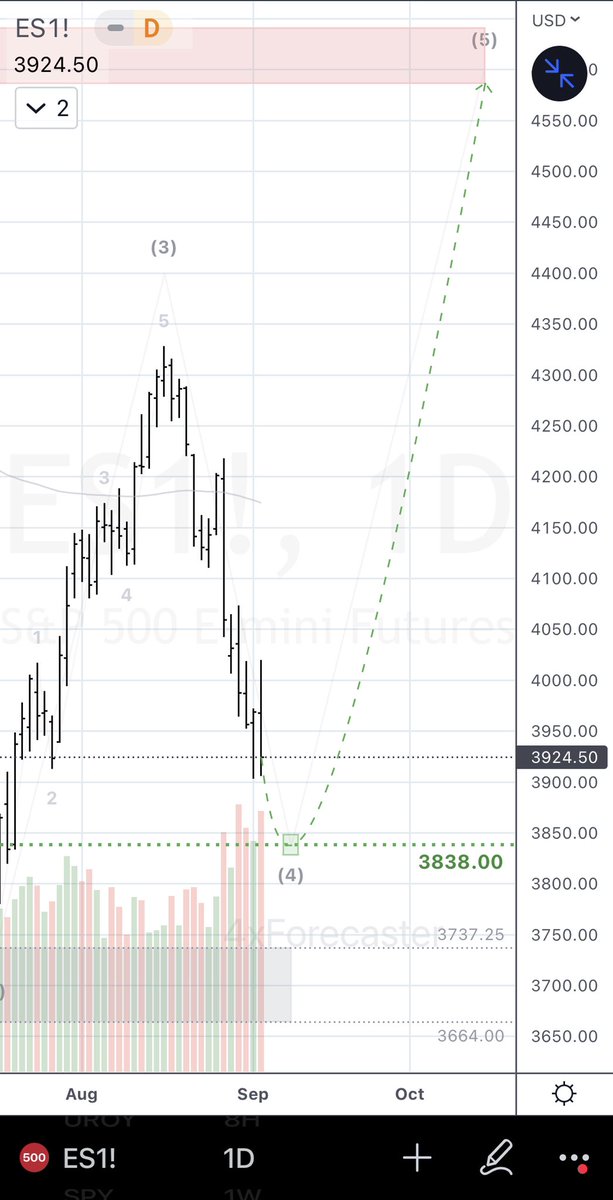
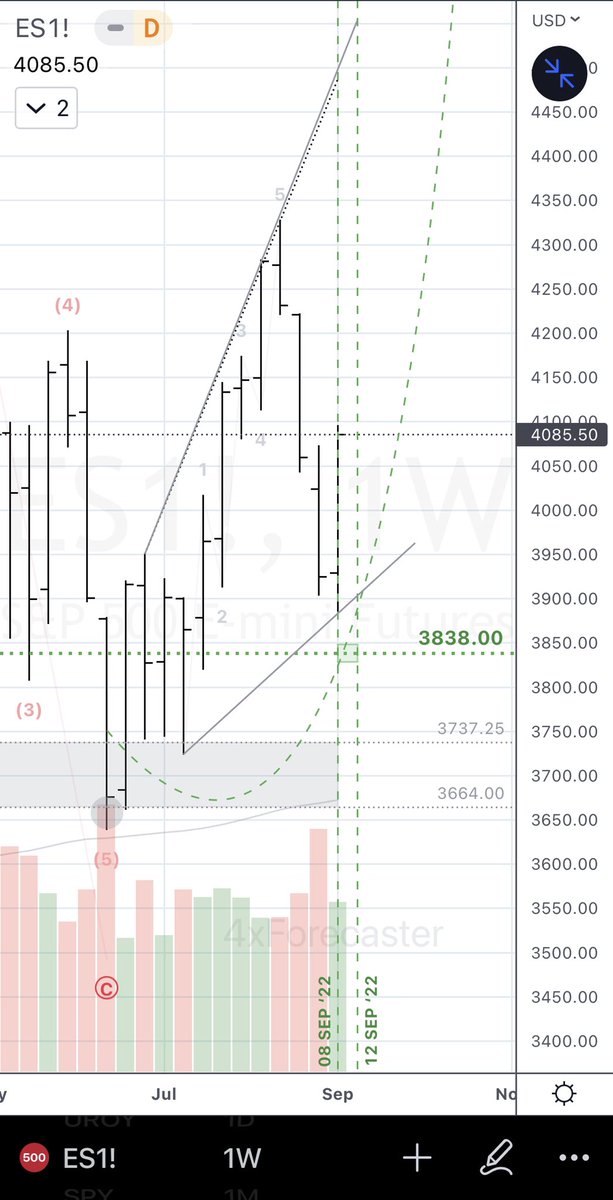
$ES (S&P-500 e-Mini Futures):
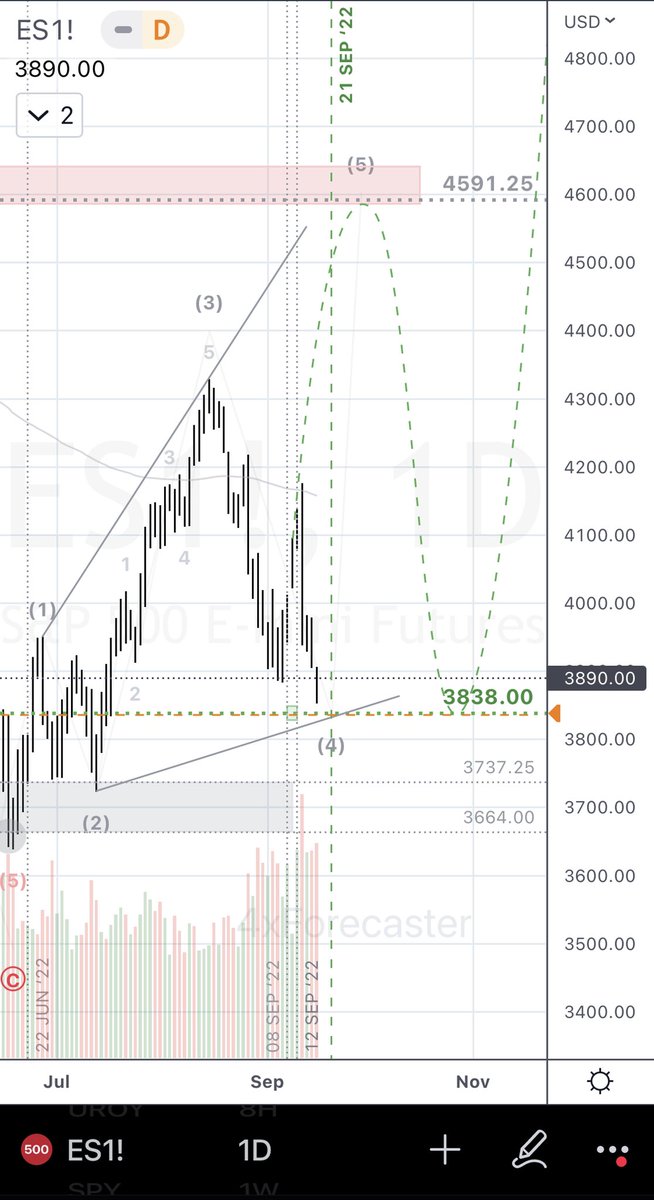
- ST: prior impulse invalidated; for current EW pattern (expanding leading diagonal: 5-3-5-3-5) to survive, wave-(4) must end at/near 3838.00 (circa 08-12 SEP per tentative timing)
- MT: bullish
- LT: bearish
#SP500 #ES1 #SPX #SPY
- ST: prior impulse invalidated; for current EW pattern (expanding leading diagonal: 5-3-5-3-5) to survive, wave-(4) must end at/near 3838.00 (circa 08-12 SEP per tentative timing)
- MT: bullish
- LT: bearish
#SP500 #ES1 #SPX #SPY
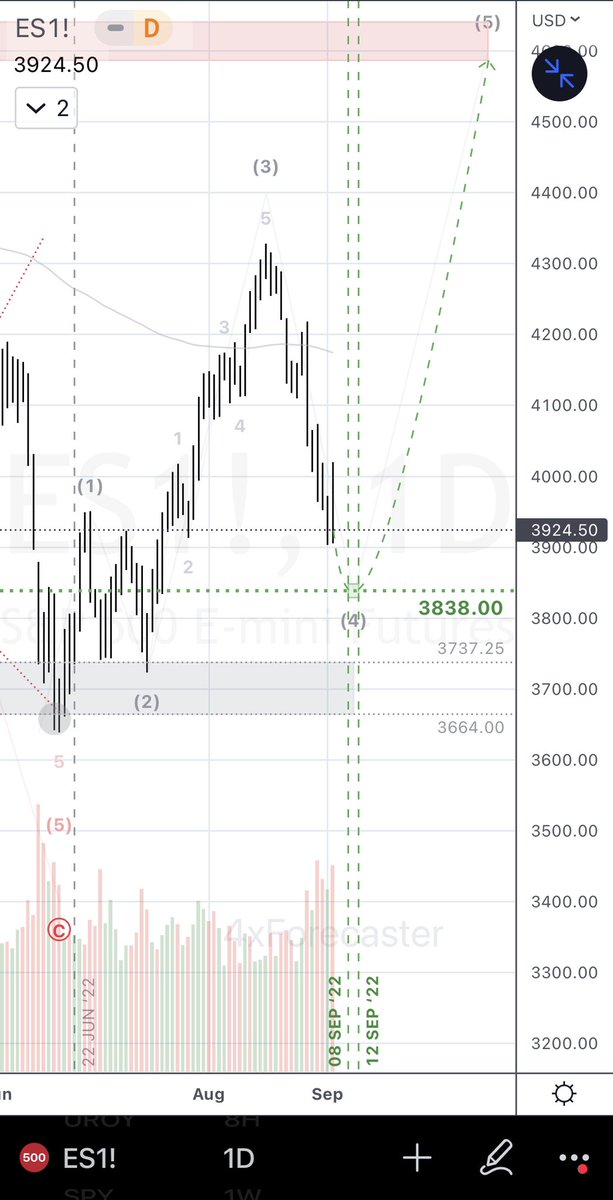
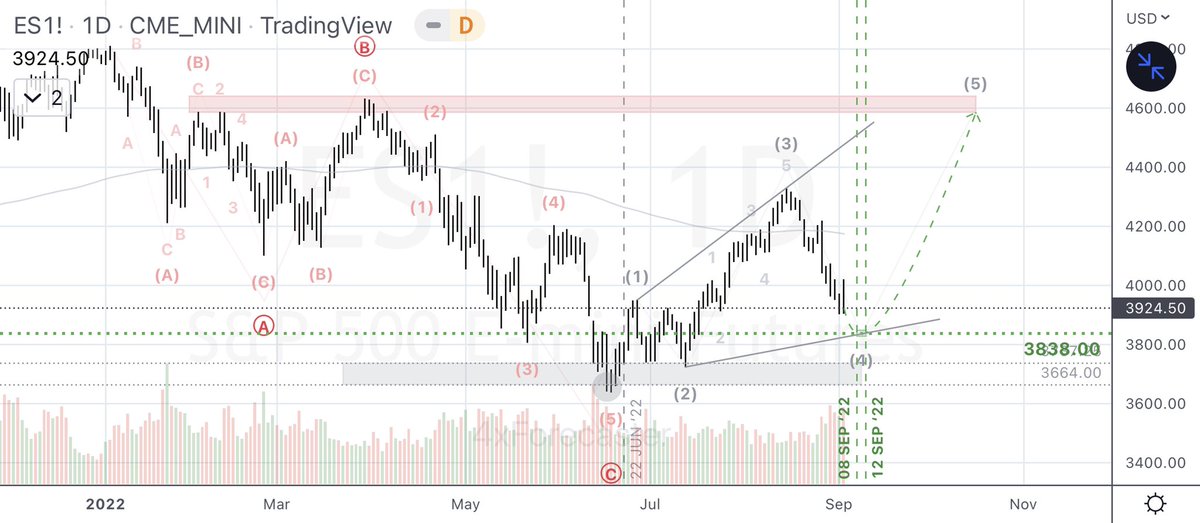
$ES (S&P-500 e-Mini Futures):
- ST: rallying at tentative time-target window of 08 SEP/12 SEP as forecast
- MT: bullish
- LT: bearish
#SP500 #ES1 #SPX #SPY
- ST: rallying at tentative time-target window of 08 SEP/12 SEP as forecast
- MT: bullish
- LT: bearish
#SP500 #ES1 #SPX #SPY

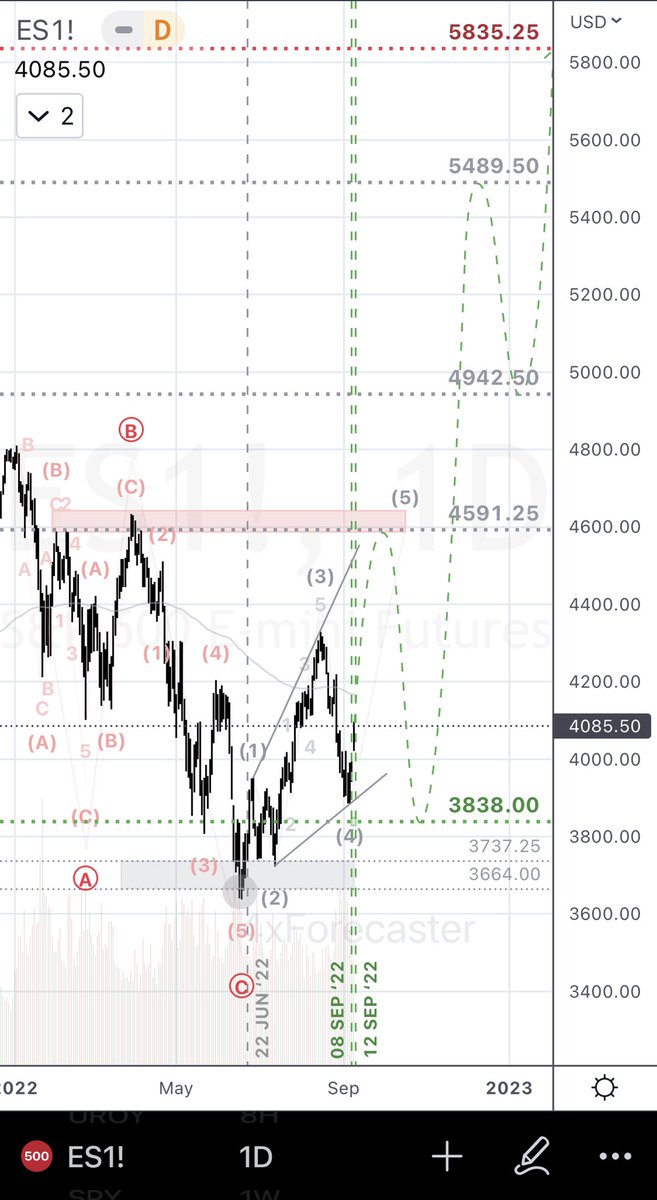
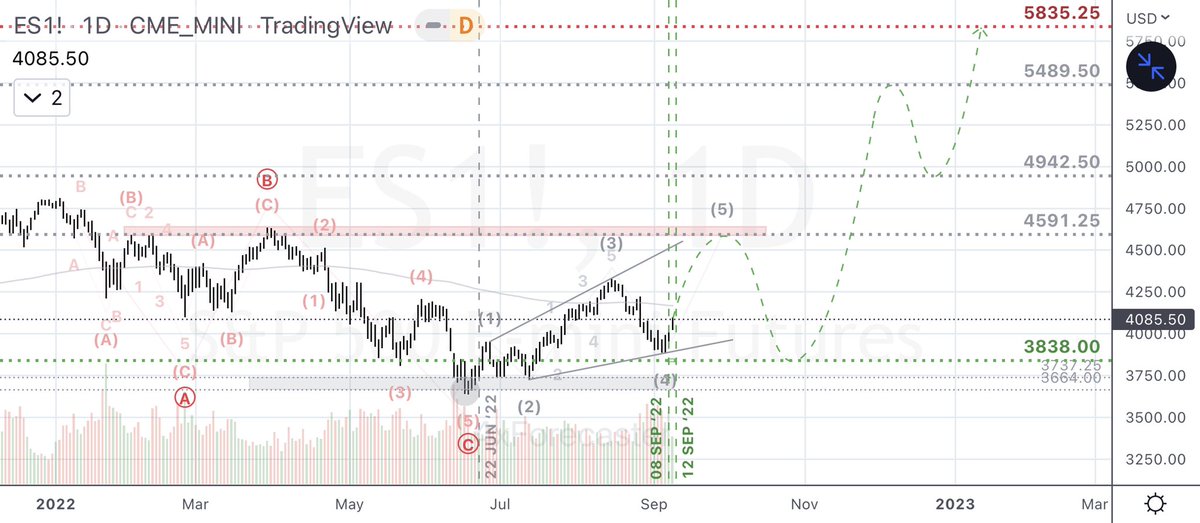
$ES (S&P-500 e-Mini Futures):
* * * NEW Targets * * *
- ST: rallying at tentative time-target 08-12 SEP as forecast; watching these R/S targets
4491.25-R (21 SEP ‘22?)
3838.0-S
5489.50-R
4942.50-S
5835.25 (NEW price-target)
- MT: bullish
- LT: bearish
#SP500 #ES1 #SPX #SPY
* * * NEW Targets * * *
- ST: rallying at tentative time-target 08-12 SEP as forecast; watching these R/S targets
4491.25-R (21 SEP ‘22?)
3838.0-S
5489.50-R
4942.50-S
5835.25 (NEW price-target)
- MT: bullish
- LT: bearish
#SP500 #ES1 #SPX #SPY
$ES (S&P-500 e-Mini Futs):
- ST: falling towards 3838.00 target as forecast; time-target saw rallies on weaker volume; now eyeing strength circa 21 SEP ‘22 as possible confluence of price-target and time-target levels.
- MT: bullish
- LT: bearish
#SP500 #ES1 #SPX #SPY $ES_F
- ST: falling towards 3838.00 target as forecast; time-target saw rallies on weaker volume; now eyeing strength circa 21 SEP ‘22 as possible confluence of price-target and time-target levels.
- MT: bullish
- LT: bearish
#SP500 #ES1 #SPX #SPY $ES_F
Re: $ES
RT from @CyclesFan … similar time-target (see thread), 21 SEP ‘22
RT from @CyclesFan … similar time-target (see thread), 21 SEP ‘22
https://twitter.com/CyclesFan/status/1572318448004337670
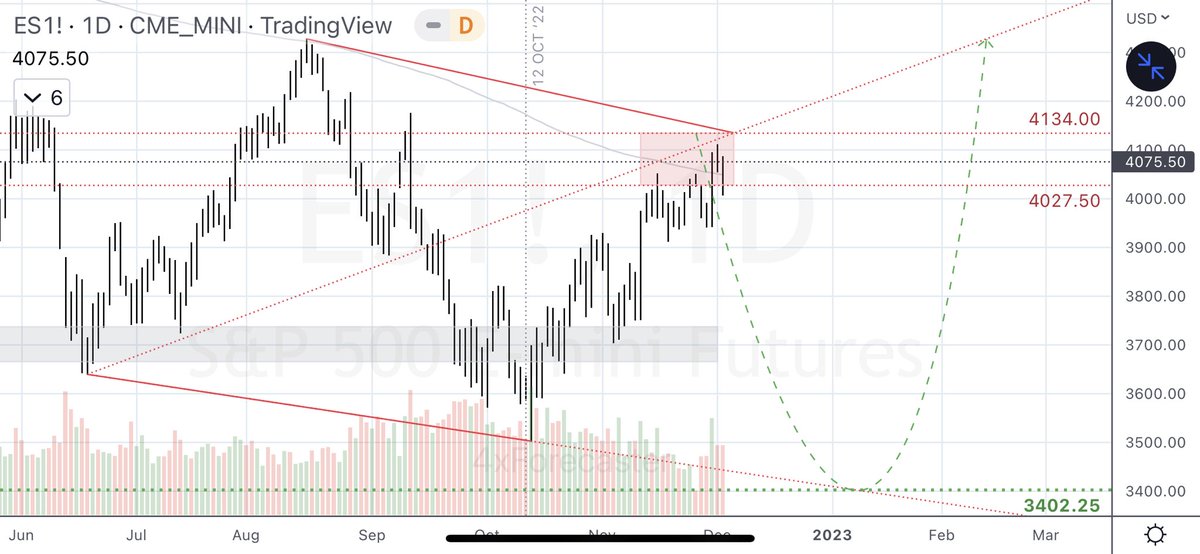
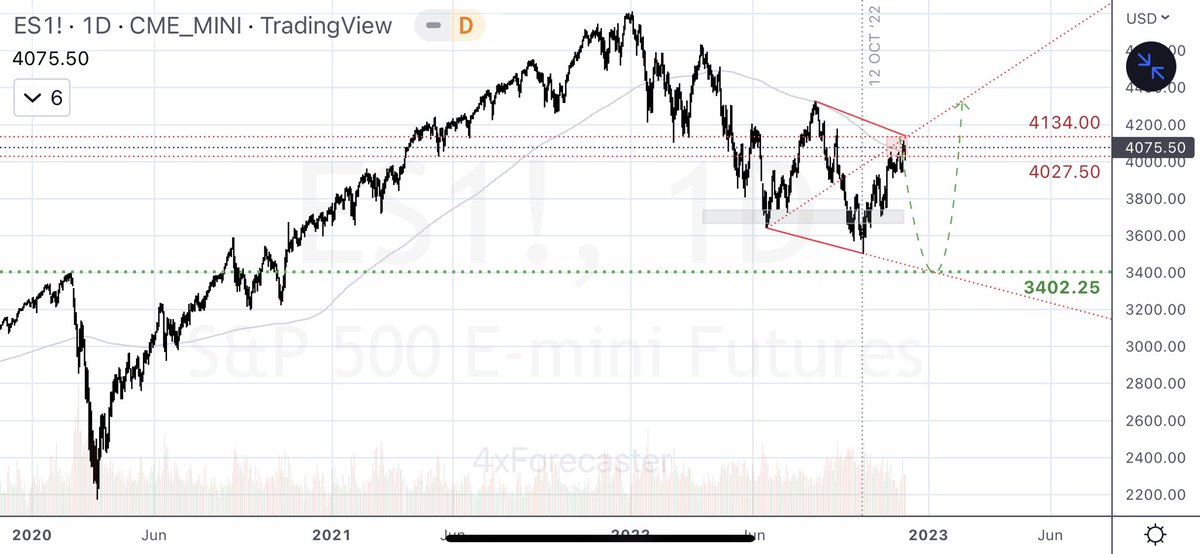
$ES (S&P-500 e-Mini Futs):
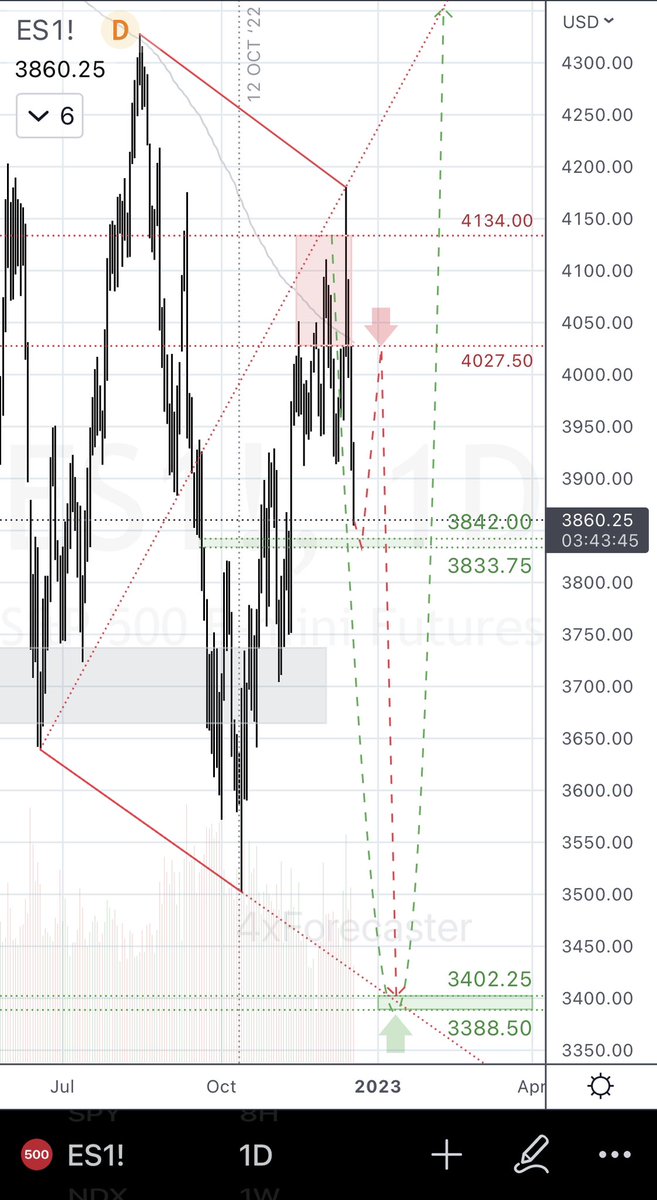
- ST: RISK of lower low from current vicinity, eyeing interim and imminent bearish reversal at the 4027.50/4134.00 target range; eyeing bullish reversal target at 3402.25
- MT: bullish
- LT: bearish
#SP500 #ES1 #SPX #SPY $ES_F
- ST: RISK of lower low from current vicinity, eyeing interim and imminent bearish reversal at the 4027.50/4134.00 target range; eyeing bullish reversal target at 3402.25
- MT: bullish
- LT: bearish
#SP500 #ES1 #SPX #SPY $ES_F

$ES:
PERSPECTIVE
- RT from @ChandlerTrading:
PERSPECTIVE
- RT from @ChandlerTrading:
https://twitter.com/ChandlerTrading/status/1598785600643076114
$ES (S&P-500 e-Mini Futs):
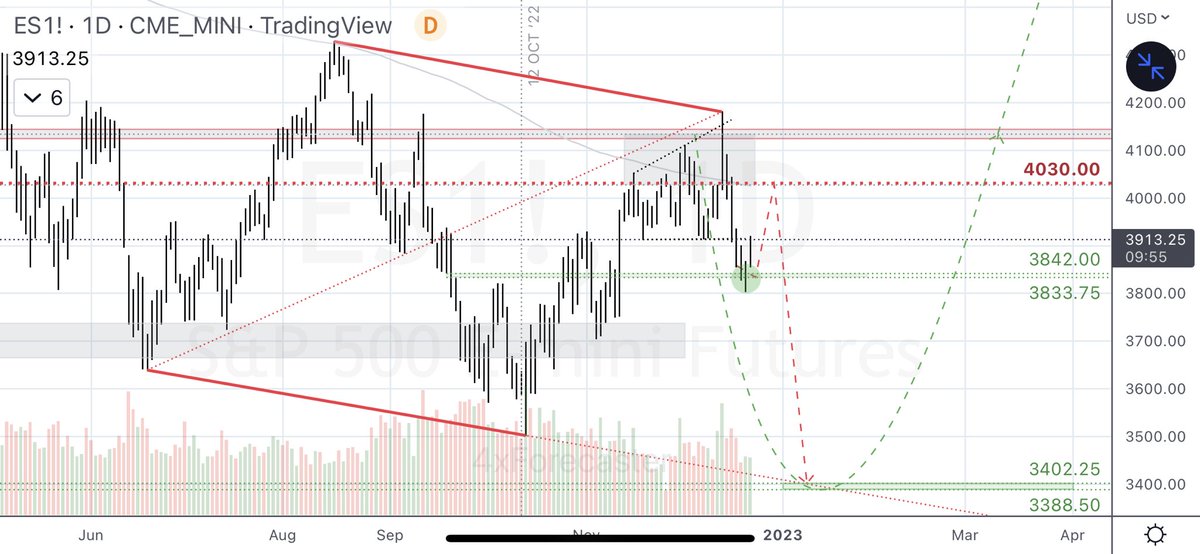
- ST: still reversing as forecast from its bearish reversal target range at 4027.50/4134.00 target range; watching for interim support at 3842.00/3833.75; unchanged RISK of decline to 3402.25
- MT: bullish
- LT: bearish
#SP500 #ES1 #SPX #SPY $ES_F
- ST: still reversing as forecast from its bearish reversal target range at 4027.50/4134.00 target range; watching for interim support at 3842.00/3833.75; unchanged RISK of decline to 3402.25
- MT: bullish
- LT: bearish
#SP500 #ES1 #SPX #SPY $ES_F
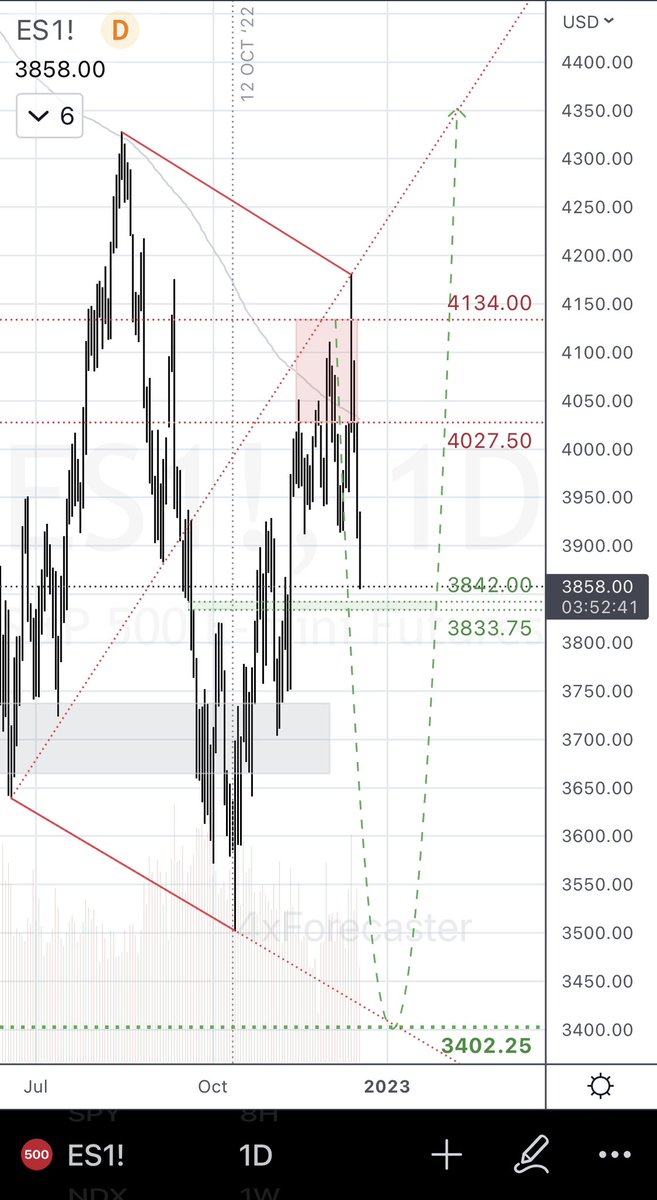
$ES (S&P-500 e-Mini Futs):
Tech-Note:
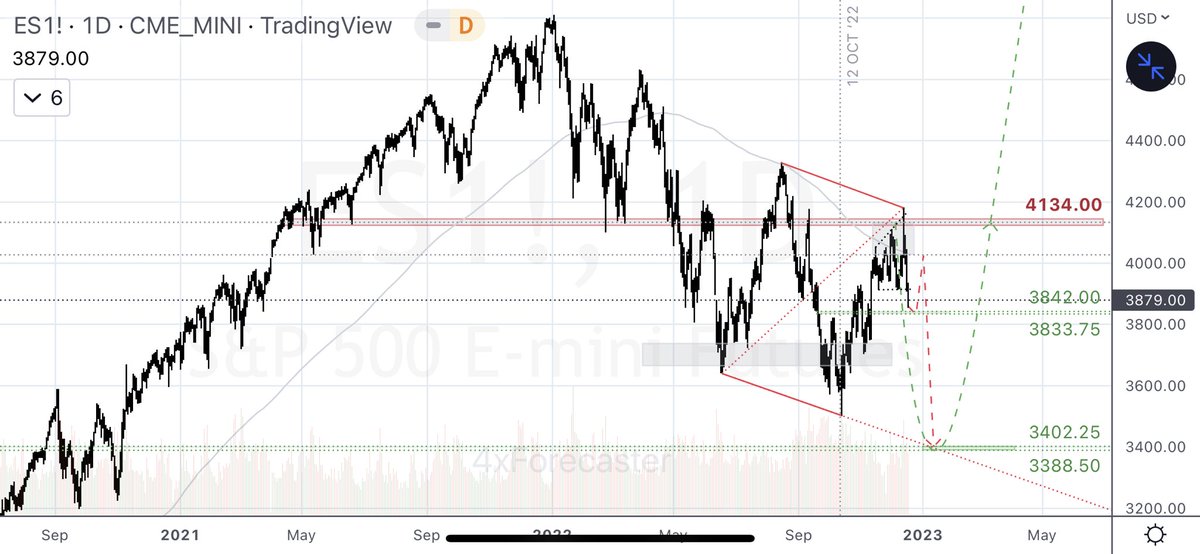
1. A rally from forecast target range at 3842.00/3833.75 would meet significant resistance at prior bearish reversal range, strongest at 4027.50
2. Invalidation of current lower-low thesis would require breach > this week’s high
3. …
Tech-Note:
1. A rally from forecast target range at 3842.00/3833.75 would meet significant resistance at prior bearish reversal range, strongest at 4027.50
2. Invalidation of current lower-low thesis would require breach > this week’s high
3. …
$ES (S&P-500 e-Mini Futs):
(…)
3. Decline from 4027.50 would establish a slightly lower target, effectively defining a bullish reversal target range at 3402.25/3388.50
D.
(…)
3. Decline from 4027.50 would establish a slightly lower target, effectively defining a bullish reversal target range at 3402.25/3388.50
D.

Re: $ES and The Santa Clause Rally effects
Attaching my review of SCR, it’s historical timing and performance, and how it may apply to the current $ES pricing:
Attaching my review of SCR, it’s historical timing and performance, and how it may apply to the current $ES pricing:
https://twitter.com/4xForecaster/status/1603786441519431680
$ES (S&P-500 e-Mini Futs):
Tech-Note:
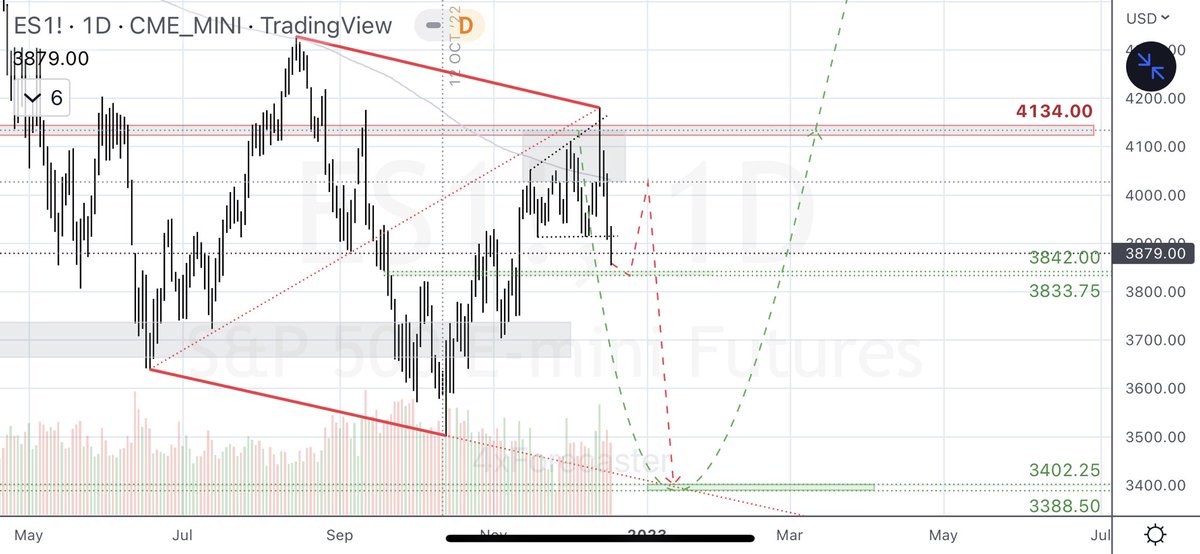
For a rally to occur right away (i.e.: a Santa Claus Rally, plus setting aside historical facts that it could occur until a week from now and it would require beating the 7.3% record gain), a 4134.00 ceiling …
#SP500 #ES1 #SPX #SPY $ES_F
Tech-Note:
For a rally to occur right away (i.e.: a Santa Claus Rally, plus setting aside historical facts that it could occur until a week from now and it would require beating the 7.3% record gain), a 4134.00 ceiling …
#SP500 #ES1 #SPX #SPY $ES_F
$ES
Tech-Note:
… constitute the type of resistance that may best be overcome by the force compression assimilated in inter-collapsing, strength-gathering geometries, such as Ending Diagonal.
Just a thought.
D.
Tech-Note:
… constitute the type of resistance that may best be overcome by the force compression assimilated in inter-collapsing, strength-gathering geometries, such as Ending Diagonal.
Just a thought.
D.
$ES:
PERSPECTIVE:
Here is a good follow, giving winning trades; here offering a similar perspective on a lingering bear strength in $SPY:
- RT from @Mr_Derivatives:
PERSPECTIVE:
Here is a good follow, giving winning trades; here offering a similar perspective on a lingering bear strength in $SPY:
- RT from @Mr_Derivatives:
https://twitter.com/Mr_Derivatives/status/1604139341139177472
$ES (S&P-500 e-Mini Futs):
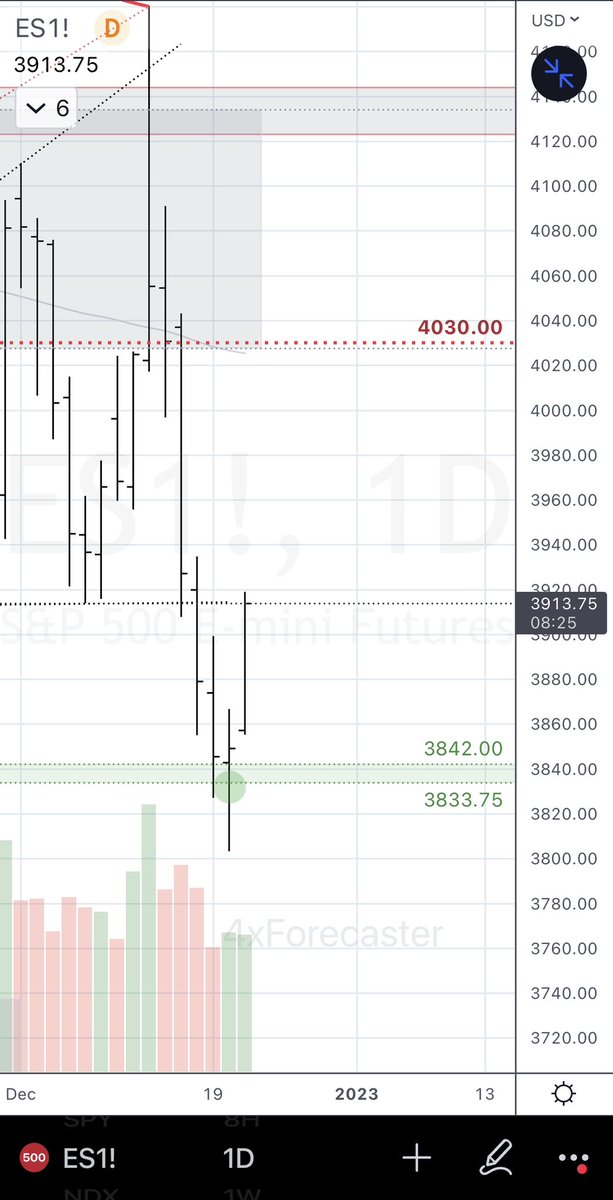
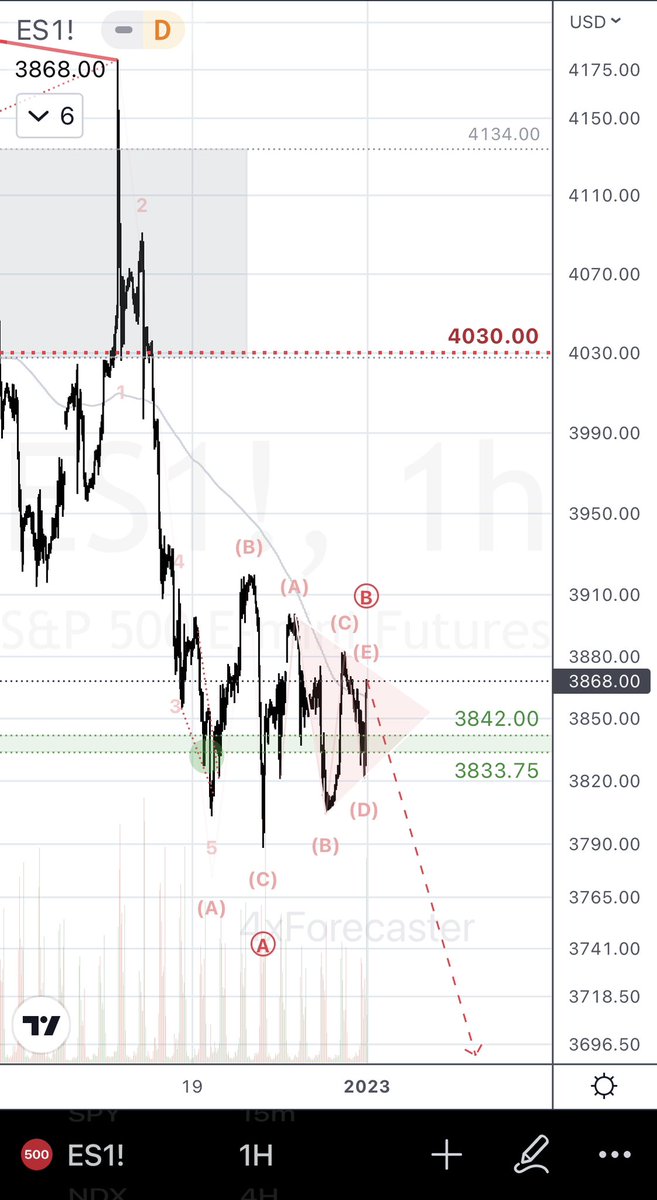
- ST: price reacted to bullish target range at 3842.00/3833.75 as forecast; watching for high-prob RISK of reversal from 4030.00 towards 3402.25/3388.50 bullish reversal target range as shown
- MT: bullish
- LT: bearish
#SP500 #ES1 #SPX #SPY $ES_F
- ST: price reacted to bullish target range at 3842.00/3833.75 as forecast; watching for high-prob RISK of reversal from 4030.00 towards 3402.25/3388.50 bullish reversal target range as shown
- MT: bullish
- LT: bearish
#SP500 #ES1 #SPX #SPY $ES_F
$ES:
Seeing 👁️ to 👁️ here, using different methods.
Perspective
- RT from @ChandlerTrading (also one I recommend following if interested in TA education):
Seeing 👁️ to 👁️ here, using different methods.
Perspective
- RT from @ChandlerTrading (also one I recommend following if interested in TA education):
https://twitter.com/ChandlerTrading/status/1605670361781133319
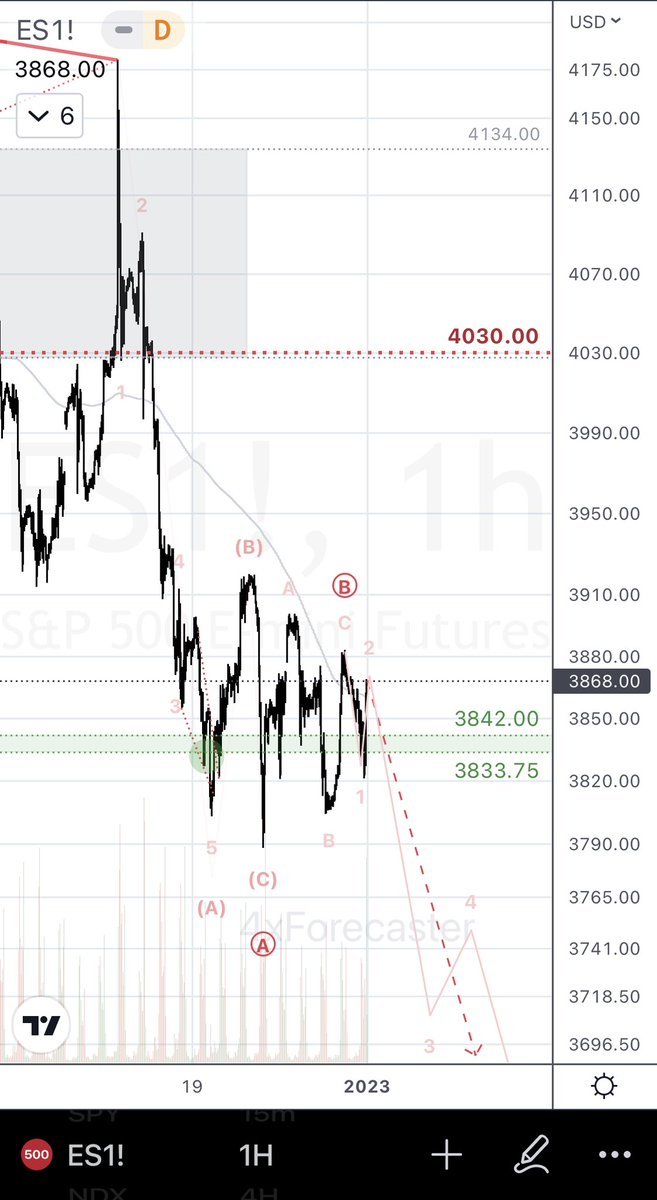
$ES (S&P-500 e-Mini Futs):
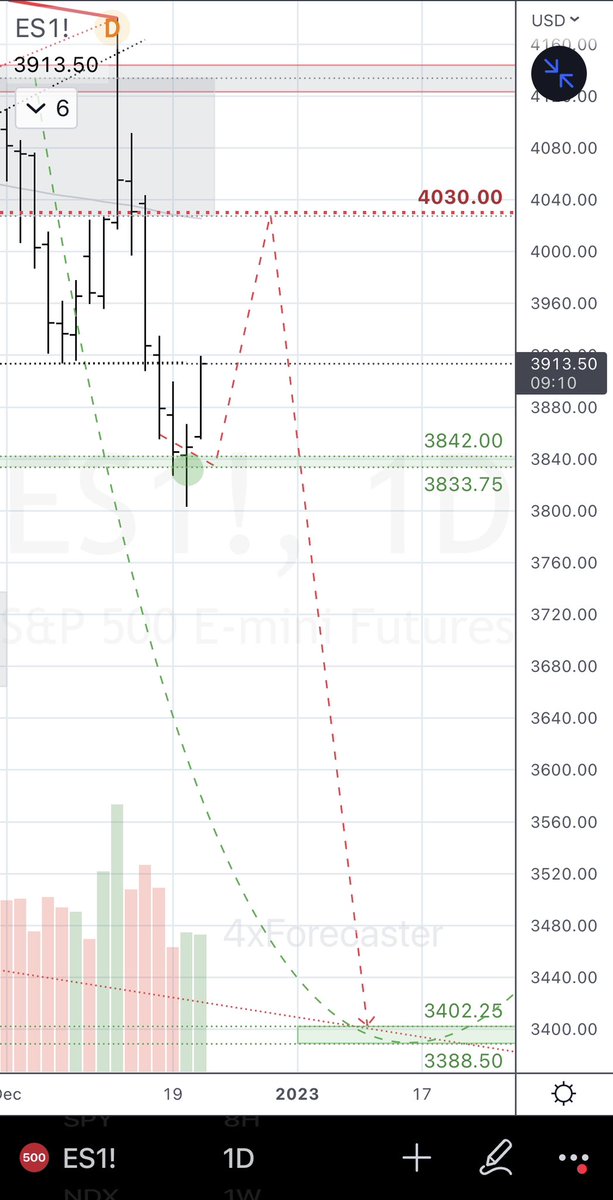
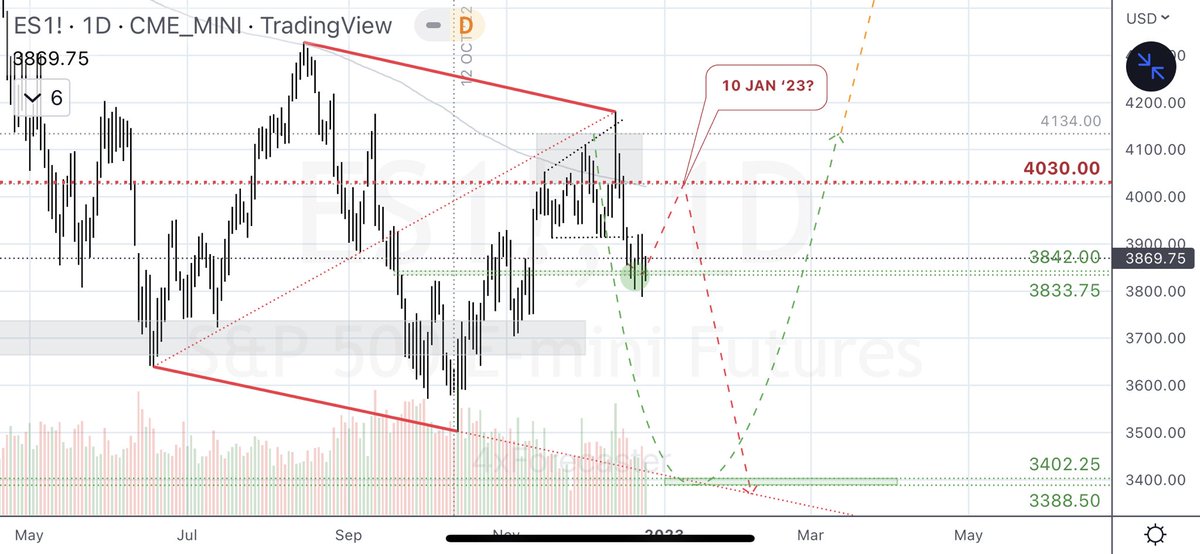
- ST: price remains above 3842.00/3833.75, still eyeing for high-prob RISK of reversal from 4030.00 to 3402.25/3388.50; watching for reversal circa 10 JAN ‘23
- MT: bullish
- LT: bearish
#SP500 #ES1 #SPX #SPY $ES_F
- ST: price remains above 3842.00/3833.75, still eyeing for high-prob RISK of reversal from 4030.00 to 3402.25/3388.50; watching for reversal circa 10 JAN ‘23
- MT: bullish
- LT: bearish
#SP500 #ES1 #SPX #SPY $ES_F
$ES:
- ST: still bearish with little more than sideways action over the week. Window for a SCR closed, adding credence for a bearish continuation thesis. Watching for this setup favoring further decline to 3402.25/3388.50. Last two charts are tentative, yet favored counts.
$SPX
- ST: still bearish with little more than sideways action over the week. Window for a SCR closed, adding credence for a bearish continuation thesis. Watching for this setup favoring further decline to 3402.25/3388.50. Last two charts are tentative, yet favored counts.
$SPX
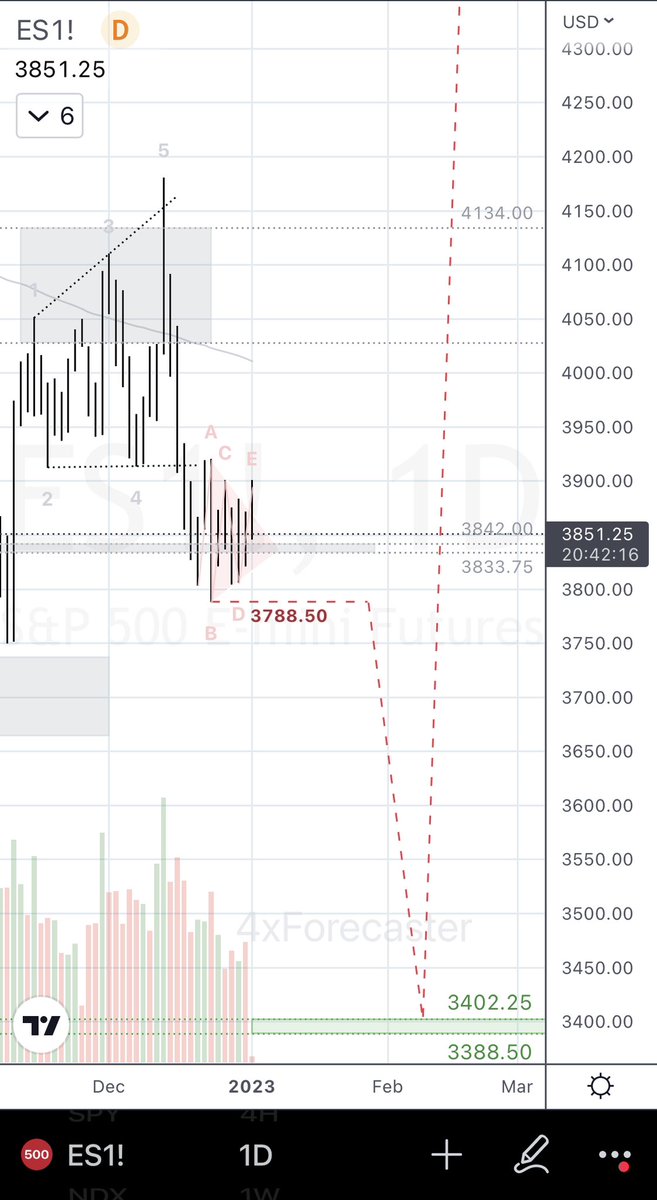
$ES:
- ST: unchanged bearish bias per model; technically, continuation geometries support bearish outlook as well; watching for 3788.50 to trigger a still favored decline to 3402.25/3388.50.
Invalidated IFF #ES > point-A of triangle.
$SPX
- ST: unchanged bearish bias per model; technically, continuation geometries support bearish outlook as well; watching for 3788.50 to trigger a still favored decline to 3402.25/3388.50.
Invalidated IFF #ES > point-A of triangle.
$SPX
$ES:
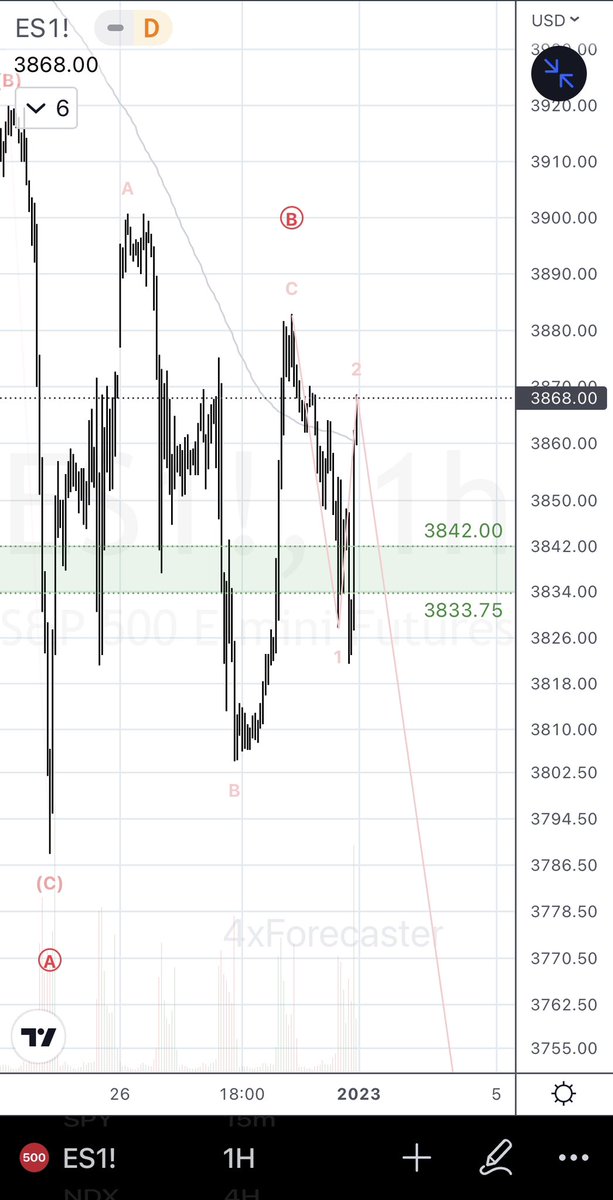
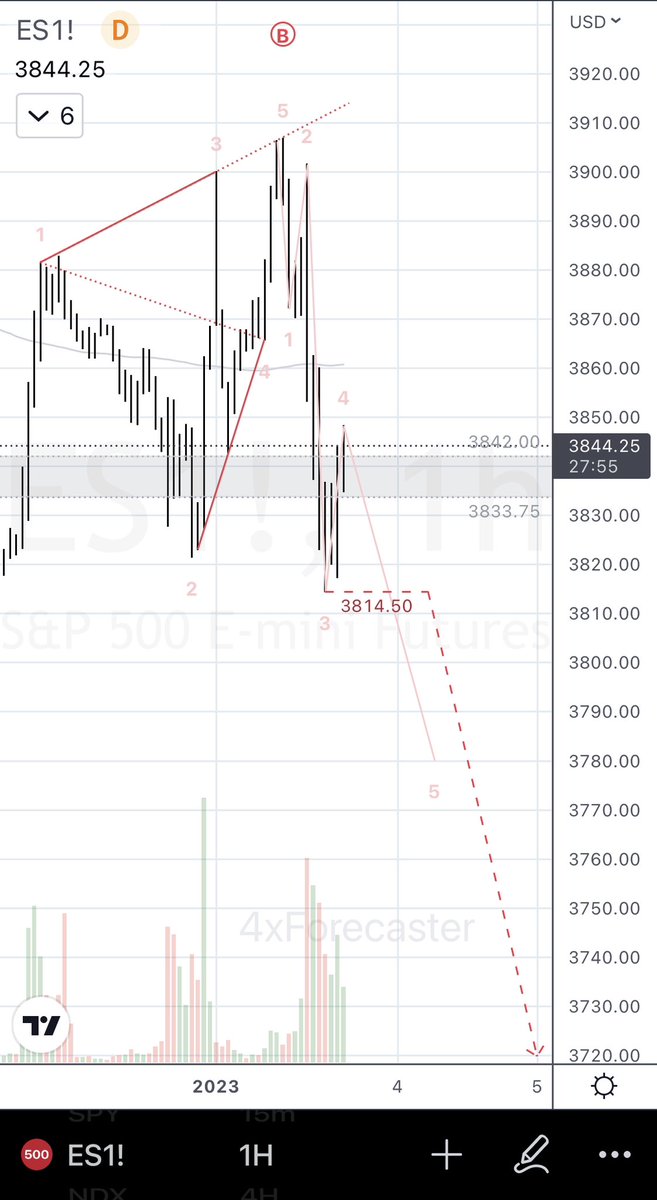
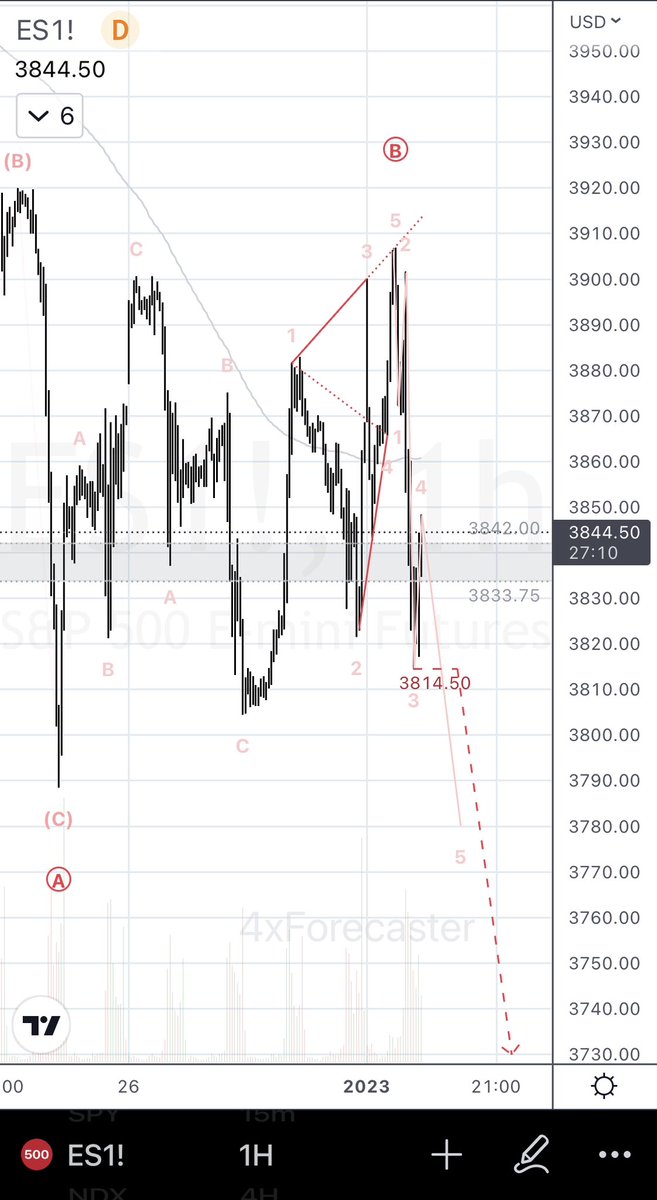
- ST: still bearish, despite interim consolidation; recent move appears impulsive (1-2-3-4-5) to the downside, suggesting possible beginning of wave-C⃝.
In any case and any interim configuration, predictive model remains bound towards target range below.
$SPX
- ST: still bearish, despite interim consolidation; recent move appears impulsive (1-2-3-4-5) to the downside, suggesting possible beginning of wave-C⃝.
In any case and any interim configuration, predictive model remains bound towards target range below.
$SPX
$ES:
Similar views, different methodology.
Perspective
- RT from @ChandlerTrading
$SPX
Similar views, different methodology.
Perspective
- RT from @ChandlerTrading
$SPX
https://twitter.com/ChandlerTrading/status/1616213659839078400
$ES:
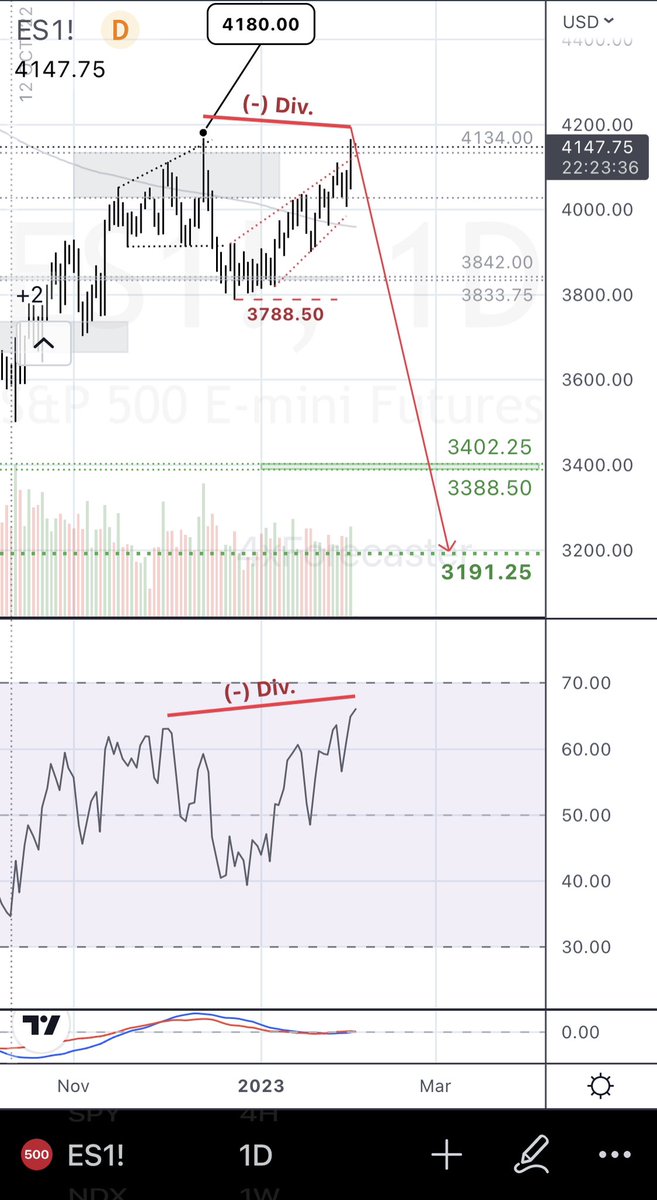
- ST: still bearish; current level is highest reversal from interim bullish reversal at 3842.00/3833.75 (see thread), before reaching invalidation > 4180.00
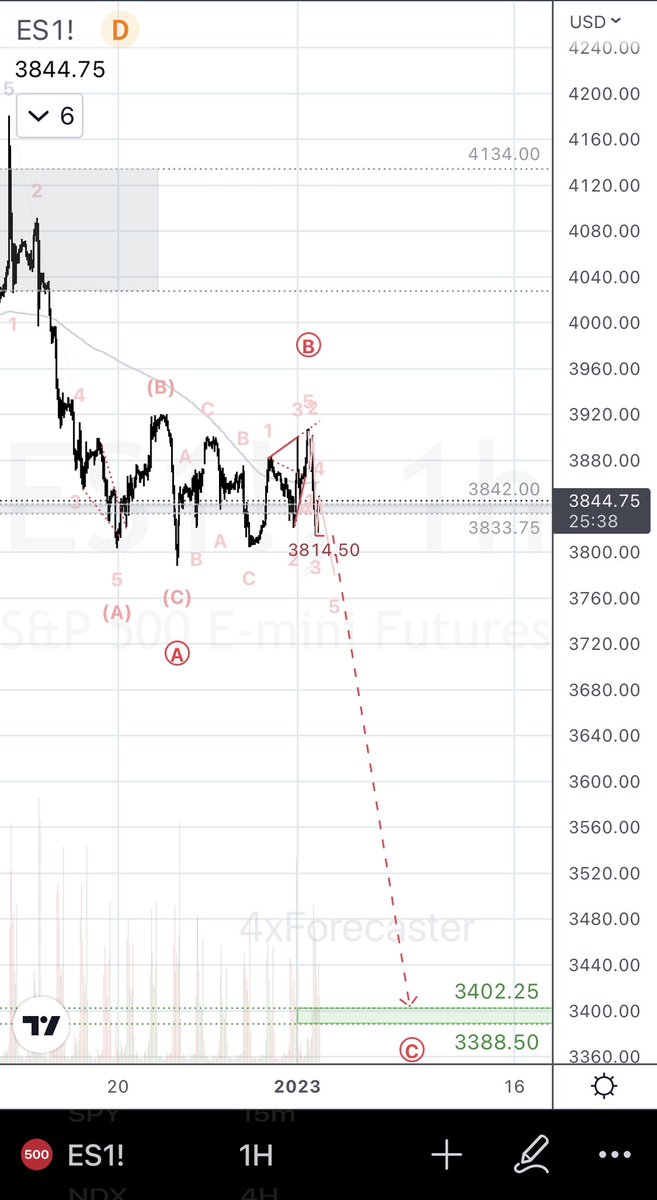
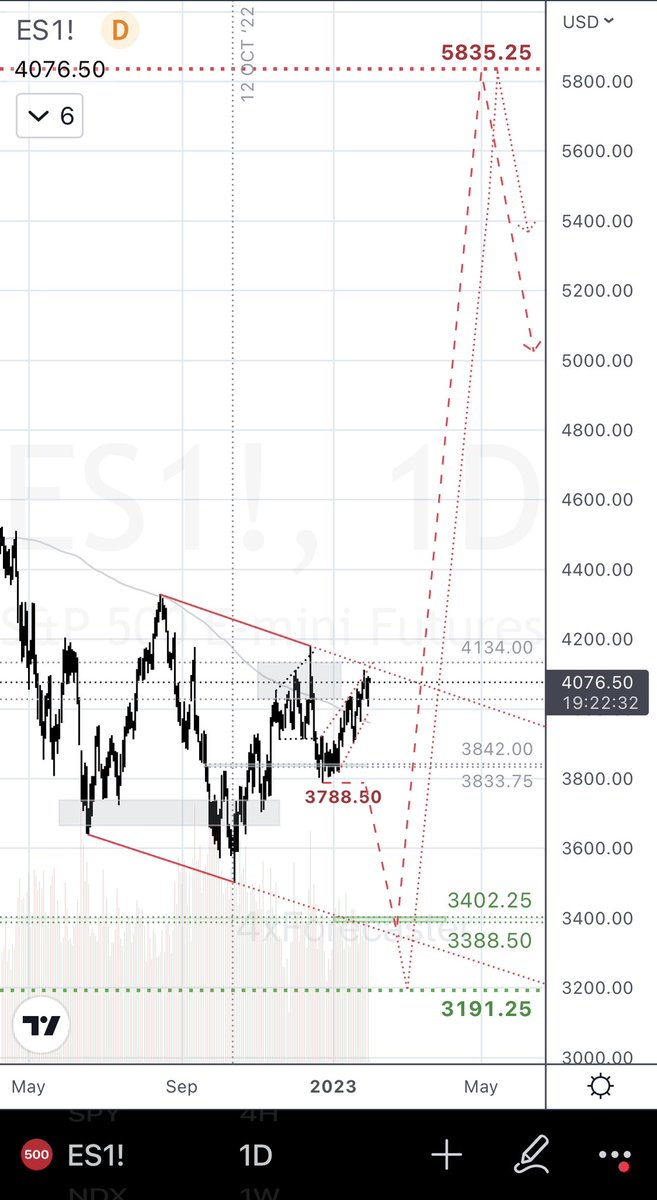
- MT: bullish, still eyeing reversal at 3402.25/3388.50; highest reversibility at 3191.25
#ES $SPX #SP500
- ST: still bearish; current level is highest reversal from interim bullish reversal at 3842.00/3833.75 (see thread), before reaching invalidation > 4180.00
- MT: bullish, still eyeing reversal at 3402.25/3388.50; highest reversibility at 3191.25
#ES $SPX #SP500
$ES
Tech-Note:
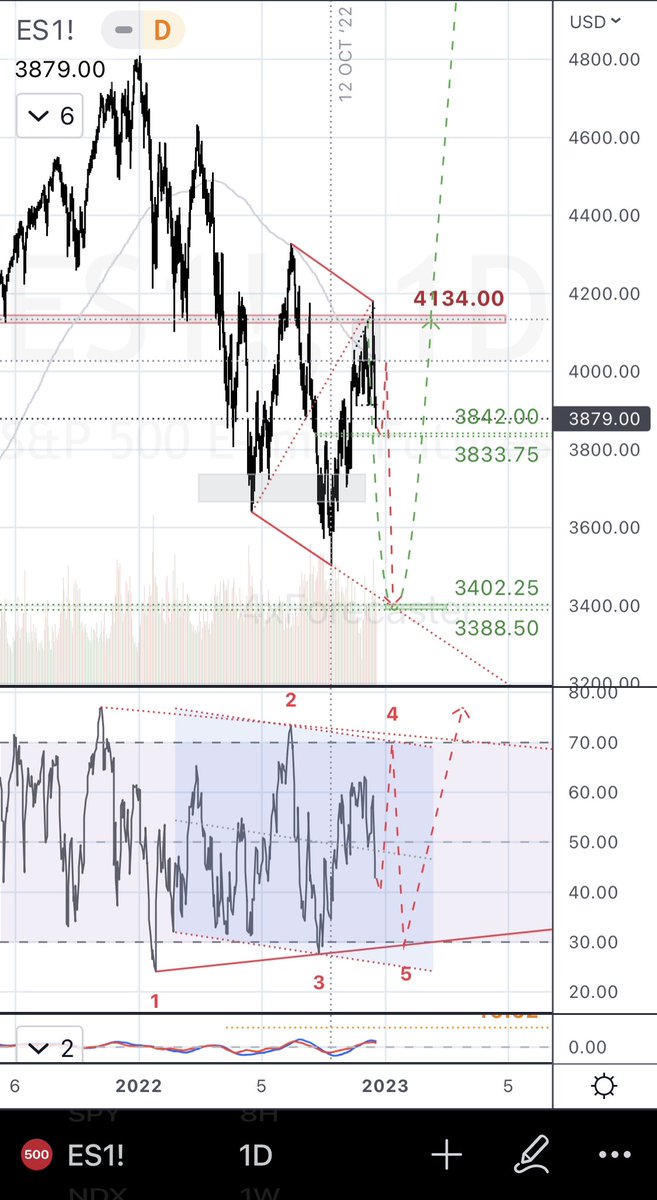
- ST: Model remains bearish. Unrelated to the predictive model, note the development of a NEGATIVE DIVERGENCE in RSI (i.e.: RSI makes a higher high relative to price peaks, whereas price makes a lower-high.
(see attached DAILY chart)
(…)
#ES $SPX #SP500
Tech-Note:
- ST: Model remains bearish. Unrelated to the predictive model, note the development of a NEGATIVE DIVERGENCE in RSI (i.e.: RSI makes a higher high relative to price peaks, whereas price makes a lower-high.
(see attached DAILY chart)
(…)
#ES $SPX #SP500
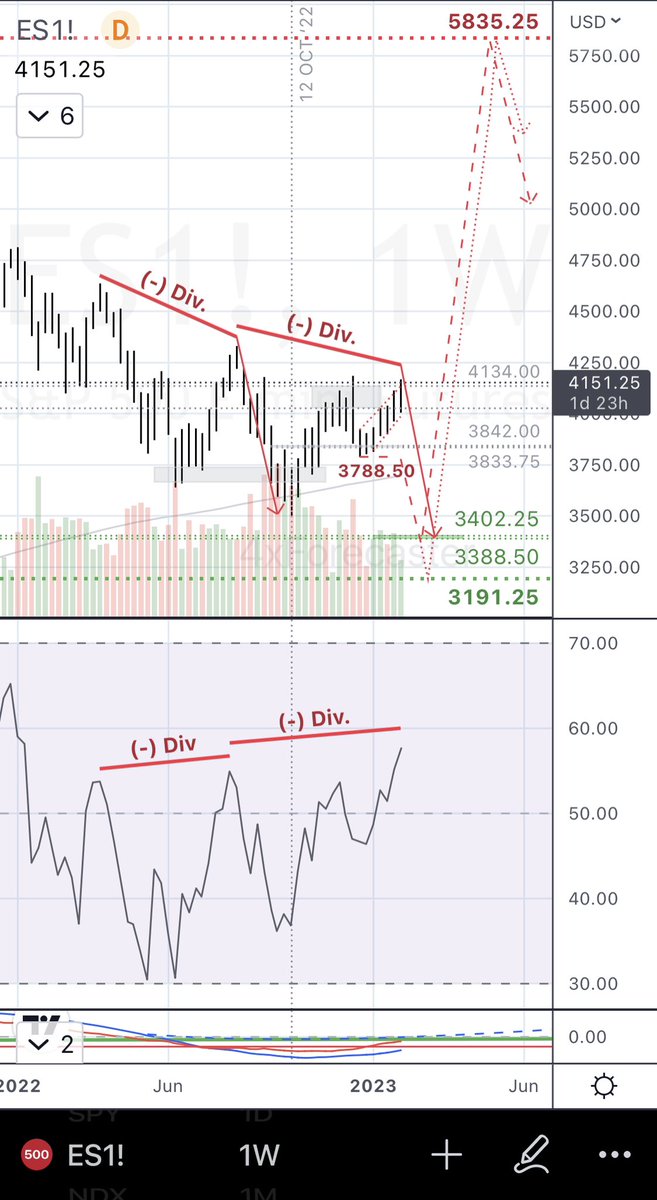
(…) As a point of illustration - and perhaps of education to those who aimlessly look for bearish divergences - here is the same chart but WEEKLY frames, wherein a same (-) Div. occurred recently, and appears to prepare once more.
(…)
(…)
(…) it would take price breaking above and closing above (BACA) its recent high at 4180.00 to erase the (-) Div in the DAILY chart.
I recently tried to explain this concept to a trader convinced that fundamental hype would support price (see attached), when it ended up falling.
I recently tried to explain this concept to a trader convinced that fundamental hype would support price (see attached), when it ended up falling.
https://twitter.com/4xforecaster/status/1615048316085227522
Overall, know your divergences. Most rookies will use RSI in ways instructed by conventional institutions.
Notions such as over/under-bought or bearish/bullish divergences are NOT helping anyone. If anything, they do NOT signal anything of imminent relevance.
Trust, but verify!
Notions such as over/under-bought or bearish/bullish divergences are NOT helping anyone. If anything, they do NOT signal anything of imminent relevance.
Trust, but verify!
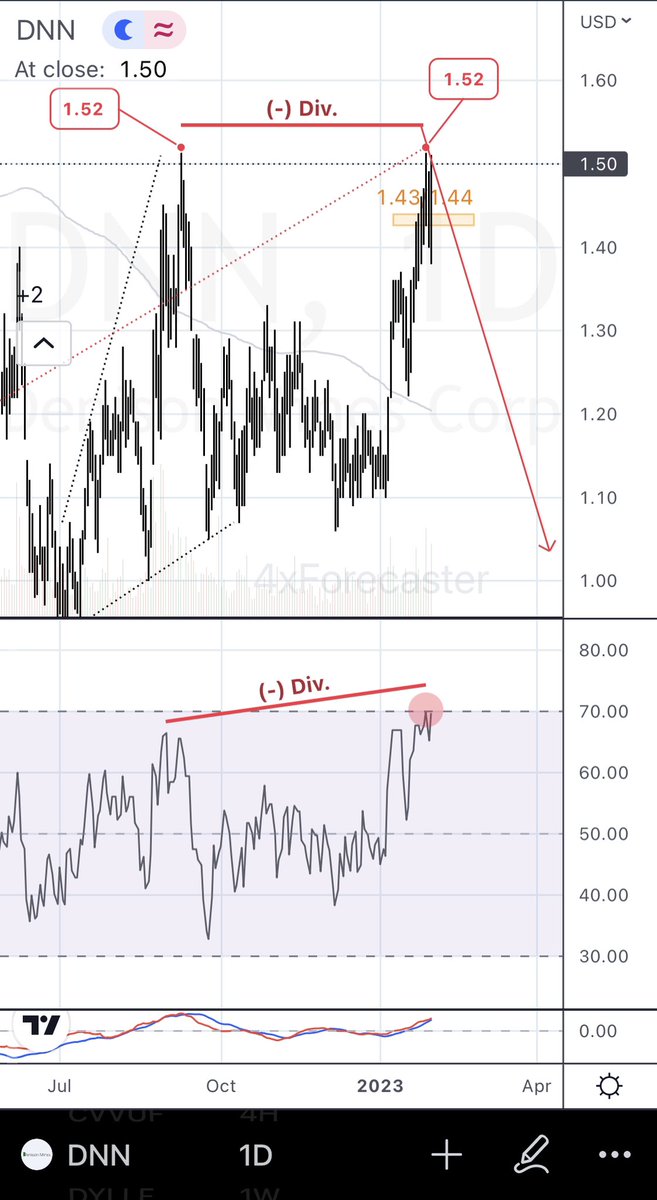
Tech-Note Addendum:
Re: (-)Div.:
Here is another illustration from $DNN, where a (-) Div would still work (i.e.: RSI highs vs lower price spikes), even in the even that a price carves a perfect double-top (here at 1.52).
Until price carved a higher-high at 1.53, (-)Div stands.
Re: (-)Div.:
Here is another illustration from $DNN, where a (-) Div would still work (i.e.: RSI highs vs lower price spikes), even in the even that a price carves a perfect double-top (here at 1.52).
Until price carved a higher-high at 1.53, (-)Div stands.
(…) Remember, you’re only dealing with probabilities (and don’t think numbers, just LOW/MOD/HIGH probability of an event occurring.
Bullish/bearish divergences- for reasons I have illustrated in the linked thread above - are LOW probability of an imminent directional event.
…
Bullish/bearish divergences- for reasons I have illustrated in the linked thread above - are LOW probability of an imminent directional event.
…
(…) In contrast, POSITIVE or NEGATIVE Divergences are rarer events with greater specificity (i.e.: “they do what they say they’ll do”), while being rare events (i.e. low sensitivity), whereas bearish/bullish divergences are very sensitive (“ring a lot”), but have a very low (…)
(…) specificity (i.e.: “they talk a lot about doing it, but don’t or not as immediately”).
Review the linked thread for illustrations, and rehearse these in your own (Google them under my alias too; been talking about these for a long while).
Cheers,
David
Review the linked thread for illustrations, and rehearse these in your own (Google them under my alias too; been talking about these for a long while).
Cheers,
David
• • •
Missing some Tweet in this thread? You can try to
force a refresh


