This feels like it should be bigger news. More There have only been 4 periods in the history of the pandemic where more in #BritishColumbia have (officially) died WITH (yay, thanks BC for obscuring data) COVID than occurred in the first week of May (May 1-7).
#bcpoli #BCStorm
/1
This is all because BC has intentionally distorted the data. As of April 2, all deaths where a positive test occurred within 30 days are being counted. Die of a car crash + covid test positive? Covid death!

/2
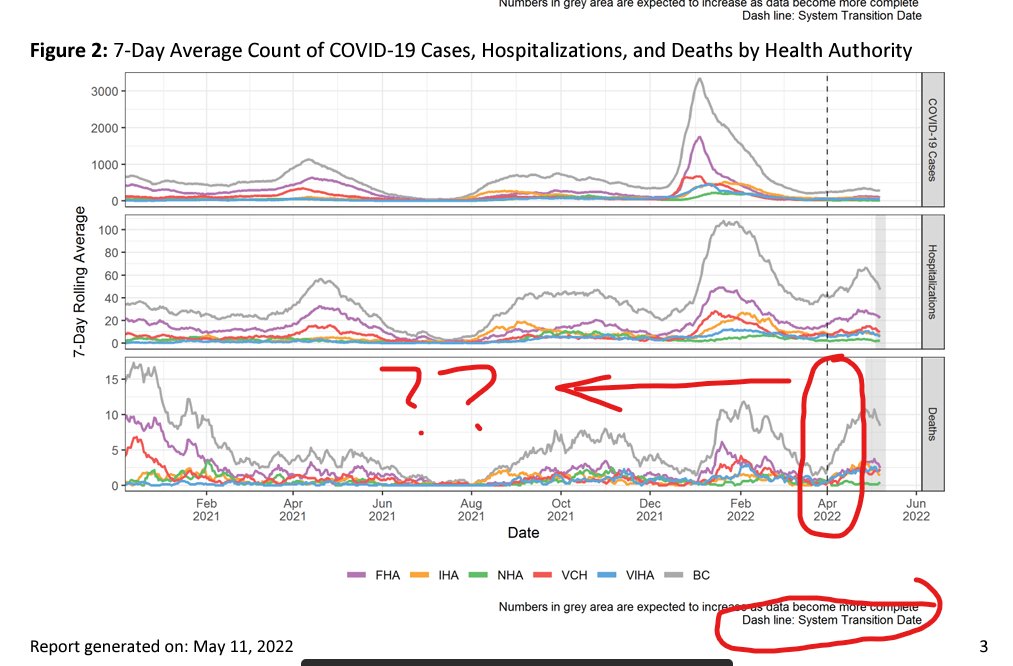
Of course, CDCBC *COULD* easily go back &retroactively apply this definition to the start of the pandemic (this would help us understand what the increasing #'s mean in context), but of course that would severely increase the official count of COVID-19 deaths. Bad politics?
/3
Or easily issue a memorandum that when declaring a time of death a tentative "do we think covid contributed" flag be instantly reported to CDCBC, to be later clarified by coroner.

Instead we get this weirdness (I checked with JHU data to ensure mine was OK).

Disappointing.

• • •

Missing some Tweet in this thread? You can try to force a refresh
 

Keep Current with Tyler Black, MD

Tyler Black, MD Profile picture

Stay in touch and get notified when new unrolls are available from this author!

Read all threads

This Thread may be Removed Anytime!

PDF

Twitter may remove this content at anytime! Save it as PDF for later use!

Try unrolling a thread yourself!

how to unroll video
  1. Follow @ThreadReaderApp to mention us!

  2. From a Twitter thread mention us with a keyword "unroll"
@threadreaderapp unroll

Practice here first or read more on our help page!

More from @tylerblack32

May 18
Excess mortality in BC since the start of COVID-19 is suggestive of an severe undercount of pandemic deaths (as has been seen in many other countries). The excess mortality caused by the heat wave or toxic drug supply is not sufficient to explain the gap.

Sorce: @StatCan_eng
/1 Excess mortality in BC since 2020, showing the gap of 7000 i
I don't know if there is some other official explanation, but in other nations this gap has been used to infer a number of deaths that are due to covid-19 that have not been coded as such.

/2
2020 saw fewer suicides and i'm not aware of significant suicide changes in 2021 either, so suicide is not a factor, I don't believe (and in fact, may have improved cumulatively)
Read 5 tweets
May 18
Here is a direct comparison of the deaths (undercount) caused by COVID-19 from the US and any nation that engaged in significant #covidzero policies past the first phase of the pandemic (Canada only there on the back of 4 atlantic provinces that held until end of 2021)

/1 graph depicting the US cumulative death rate (3000 per milli
Using cumulative excess mortality, we can see that zero covid strategies were associated with less excess death overall. Any discussions of "but they killed more due to X" are accounted for in this analysis. Approximations of recent for some added by me and rough calculations.
/2 excess mortality showing the US had more than 15% more death
Policy matters and American politicians and leaders failed the people they were sworn to protect.
Read 4 tweets
May 18
Very frustrating to see the choice in presentation by the @CDCofBC for covid vaccination hosp/icu rates.

First, here is the reality: whenever we can directly compare all three groups (ages 30 to 69), vaccination prevents hospitalization and ICU admission.

#VaccinesWork

/1 These graphs show each age bracket and the rate of hospitali
However, when we lose resolution on the absence of vaccines (eg 70+y, where only <5% are unvaccinated), @CDCofBC makes the decision to completely squelch the unvaccinated rate and count.

Of course, NOT POSSIBLE. I've calculated: the past month, 87/1M/day, off the chart!

/2 the same graph for 70+, but the BCCDC has removed the unvacc
We see this as well for the 18-29 group. Again, the graph here is impossible, and a specific and odd presentation choice by the BC CDC.

on this graph, the rate in the past month 20.9 per 1M per day, so far off the chart I had to cheat to add the space to draw it.

/3 this one is even sillier - 18-29 there is NO reason to hide
Read 13 tweets
May 17
All of the nations that I'm aware of that pursued a zero-covid-like strategy did far better over time than BC did, even though many of them abandoned that strategy (many at around aug-dec 2021).

/1 graph showing cumulative death rates for BC vs south korea,
This is most shown within Canada. There was a well-held "Atlantic bubble" of zero-covid strategy. New Brunswick broke its policy first, near July 2021, when NB Premiere Blaine Higgs ended all health-protection orders, including mask-mandates, in July.

(all better than BC)

/2 same graph but this time BC versus NB NS NL and PEI.  NB bre
This decision was poor. It's also very likely that the NB dam breaking was also largely responsible for the delta and omicron effects on the rest of atlantic canada, which had all ditched their policies by end of 2021.

aaaaand boom.

/3 same graph as previous, highlighting the 3 other non-NB atla
Read 6 tweets
May 15
Lucy McBride's article that Gregg links to here is from March 2021. Pause for a moment and think about how awful Lucy's patients felt, judged for being "coronaphobic", when 500,000 more American deaths were on the way.

/1
Instead of praising their caution for protecting themselves while vaccines we're launching (at the time, <50% of Americans were fully vaccinated), she amateurly creates a diagnosis around their non-pathological fear.

/2
In her childishly silly example, she cures her patients high blood pressure while reassuring her she can see her parents. (What a hero!)

Of course, even an amateur knows that pathological anxiety is not cured by reassurance, ironically debunking her own fake diagnosis.

/3
Read 6 tweets
May 7
A reminder that Mothers Day is not a happy day for many. For various reasons, from abusive moms to deaths to bad situations. Celebrate how you choose, honour your family (even publicly), but rememeber the above and be sensitive.

I post this on Sat, not to rain on any parades.
/1
More than 200,000 children are abused by their mothers in the United States every year, and research suggests that about 16% of children will experience child abuse.

(Note, mothers spend more time with children, so this doesn't mean that mothers are worse than fathers)

/2
That number expands significantly when emotional abuse, psychological manipulation, and rejection of identity is concerned.

Adult children can often feel the pressure and abuse of their mothers well into adulthood.

About 15% of people by the age of 25 have had a parent die.

/3
Read 6 tweets

Did Thread Reader help you today?

Support us! We are indie developers!


This site is made by just two indie developers on a laptop doing marketing, support and development! Read more about the story.

Become a Premium Member ($3/month or $30/year) and get exclusive features!

Become Premium

Don't want to be a Premium member but still want to support us?

Make a small donation by buying us coffee ($5) or help with server cost ($10)

Donate via Paypal

Or Donate anonymously using crypto!

Ethereum

0xfe58350B80634f60Fa6Dc149a72b4DFbc17D341E copy

Bitcoin

3ATGMxNzCUFzxpMCHL5sWSt4DVtS8UqXpi copy

Thank you for your support!

Follow Us on Twitter!

:(