#BTC is down -40% since the Death Cross occurred in early Jan '22
History suggests that whenever a Death Cross occurs, #Bitcoin experiences deeper downside
Now that one has occurred, what could we potentially expect?
Here's a thread with my analysis about the $BTC Death Cross:
History suggests that whenever a Death Cross occurs, #Bitcoin experiences deeper downside
Now that one has occurred, what could we potentially expect?
Here's a thread with my analysis about the $BTC Death Cross:
1.
A bullish Golden Cross occurs when the 50 EMA (blue) crosses OVER the 200 EMA (black)
Golden Crosses precede lots of upside in #BTC's price (green)
A bearish Death Cross occurs when the 50 EMA crosses UNDER the 200 EMA (red)
Death Crosses precede lots of downside for $BTC
A bullish Golden Cross occurs when the 50 EMA (blue) crosses OVER the 200 EMA (black)
Golden Crosses precede lots of upside in #BTC's price (green)
A bearish Death Cross occurs when the 50 EMA crosses UNDER the 200 EMA (red)
Death Crosses precede lots of downside for $BTC

2.
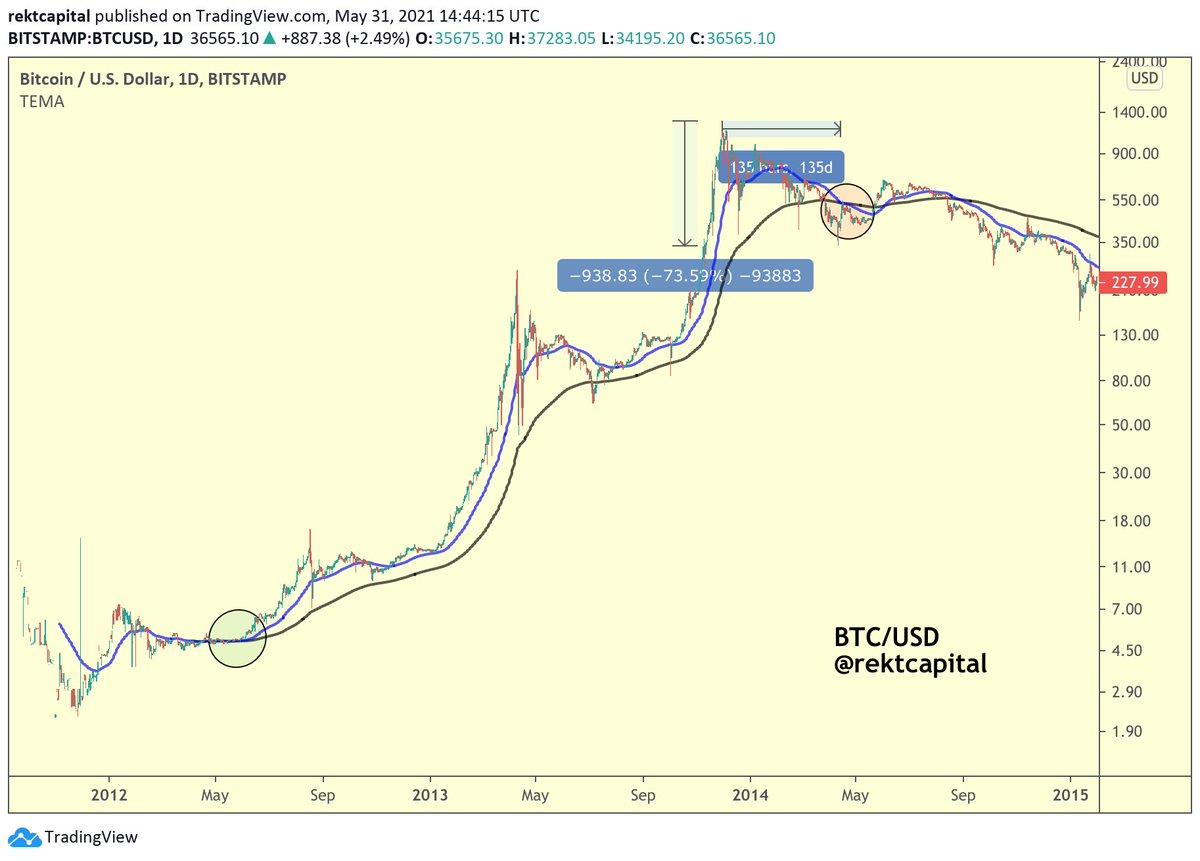
But notice how it takes a significant amount of time for #BTC to actually perform a bearish Death Cross (red)
When $BTC peaked in 2013, it took 135 days for the Death Cross to occur
That's over 4 months
And during those 4+ months...
#Bitcoin dropped -73%
But notice how it takes a significant amount of time for #BTC to actually perform a bearish Death Cross (red)
When $BTC peaked in 2013, it took 135 days for the Death Cross to occur
That's over 4 months
And during those 4+ months...
#Bitcoin dropped -73%

3.
The Death Cross occurs with some lag
So by the time it happens - a lot of downside will have already happened
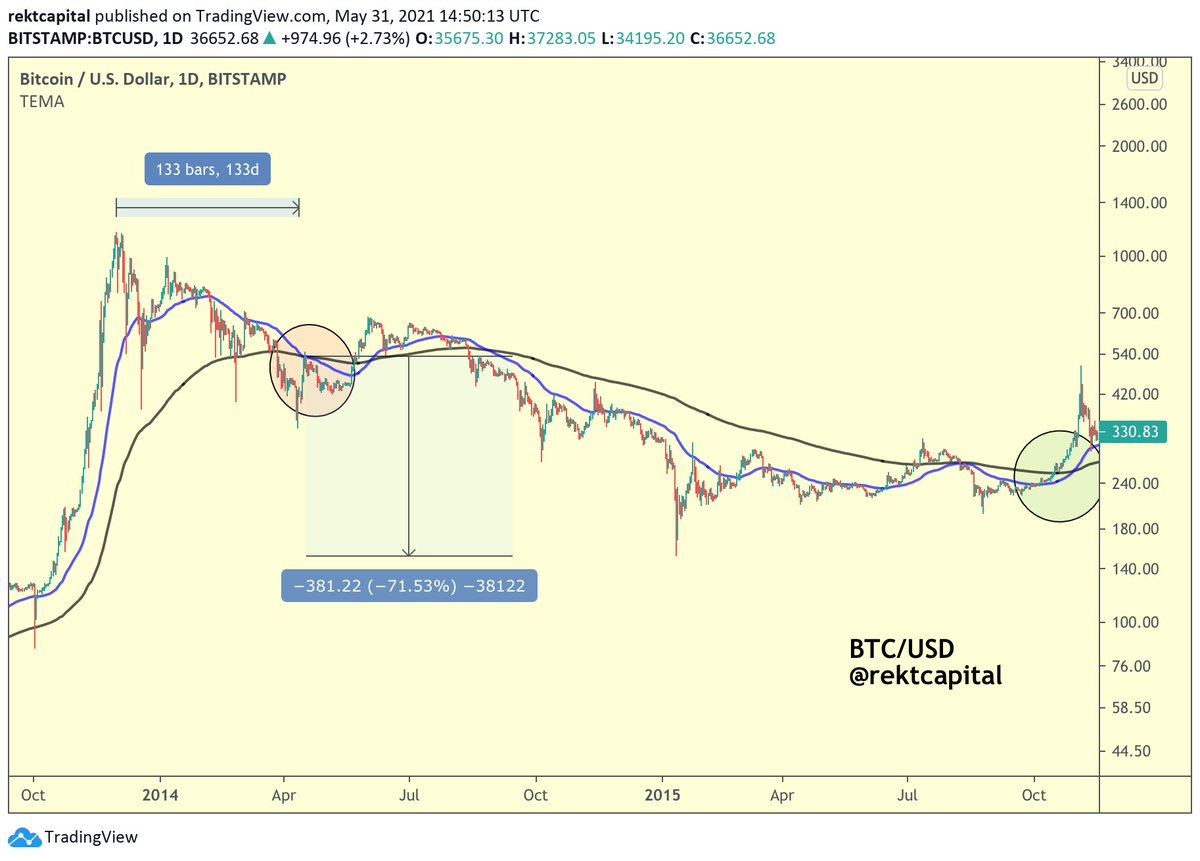
That said, the Death Cross confirms a bearish trend and precedes even more downside
And in 2013, the Death Cross preceded an additional -71% drop...
The Death Cross occurs with some lag
So by the time it happens - a lot of downside will have already happened
That said, the Death Cross confirms a bearish trend and precedes even more downside
And in 2013, the Death Cross preceded an additional -71% drop...
4.
In sum, when #BTC peaked in 2013...
BTC dropped -73% in 135 days until the Death Cross happened
And when the Death Crossover actually occurred - $BTC dropped an additional -71% in the months that followed
In sum, when #BTC peaked in 2013...
BTC dropped -73% in 135 days until the Death Cross happened
And when the Death Crossover actually occurred - $BTC dropped an additional -71% in the months that followed

5.
Let's take another period into account:
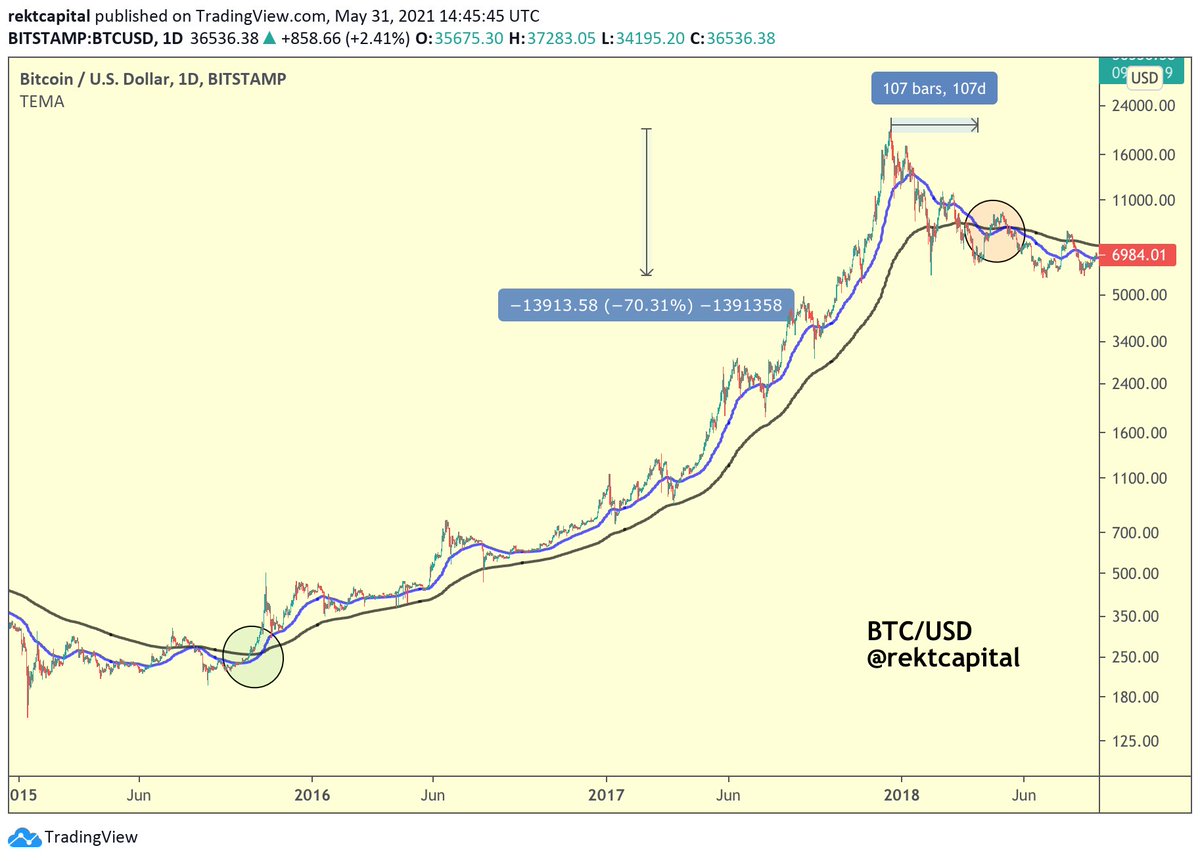
When $BTC peaked in 2017, it took 107 days for the Death Cross to occur
That's 3.5 months
And during those 3+ months...
#Bitcoin dropped -70% from the $20,000 peak
Let's take another period into account:
When $BTC peaked in 2017, it took 107 days for the Death Cross to occur
That's 3.5 months
And during those 3+ months...
#Bitcoin dropped -70% from the $20,000 peak

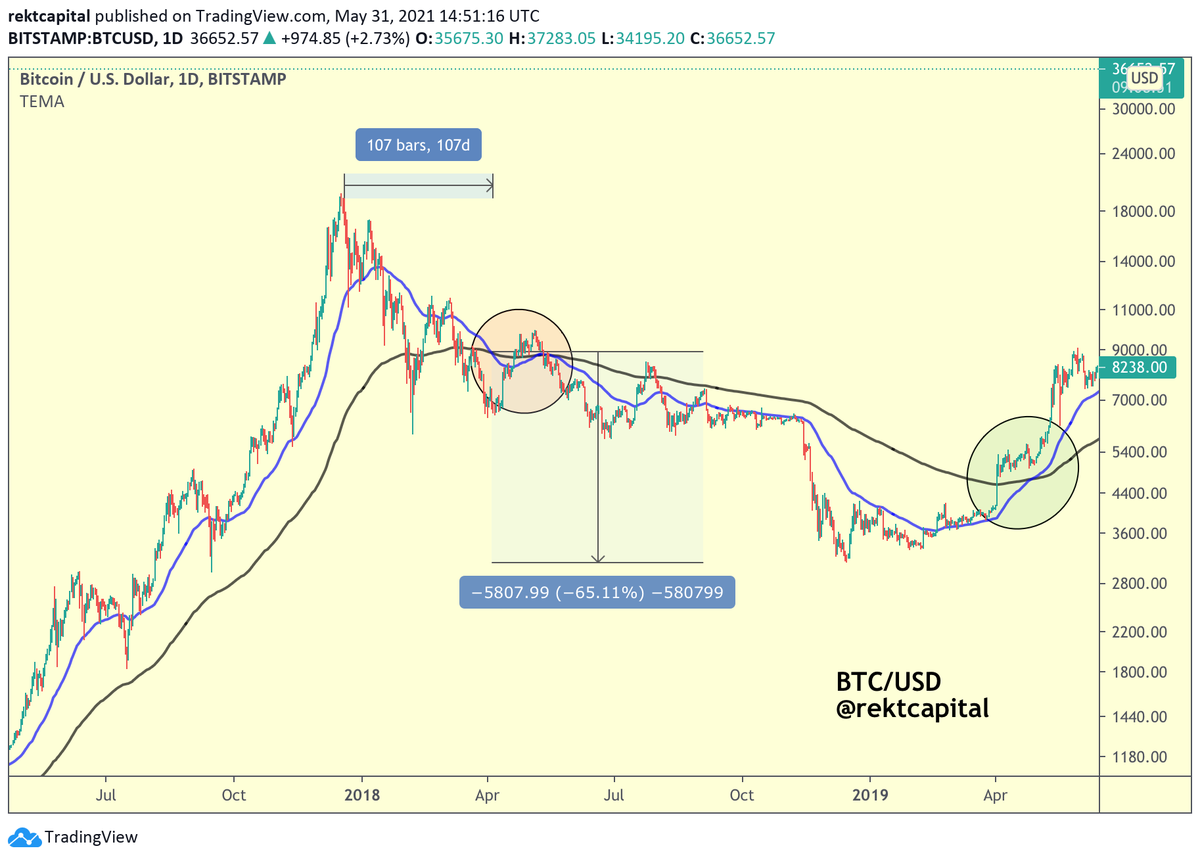
6.
Yes, #BTC dropped -70% before the Death Cross actually occurred
But once the Death Cross happened, $BTC experienced an additional -65% correction to the downside
The Death Cross once again confirmed even more downside
Yes, #BTC dropped -70% before the Death Cross actually occurred
But once the Death Cross happened, $BTC experienced an additional -65% correction to the downside
The Death Cross once again confirmed even more downside
7.
In sum, when #BTC peaked in 2017...
BTC dropped -70% in 107 days until the Death Cross happened
And when the Death Crossover actually occurred - $BTC dropped an additional -65% in the months that followed
In sum, when #BTC peaked in 2017...
BTC dropped -70% in 107 days until the Death Cross happened
And when the Death Crossover actually occurred - $BTC dropped an additional -65% in the months that followed


8.
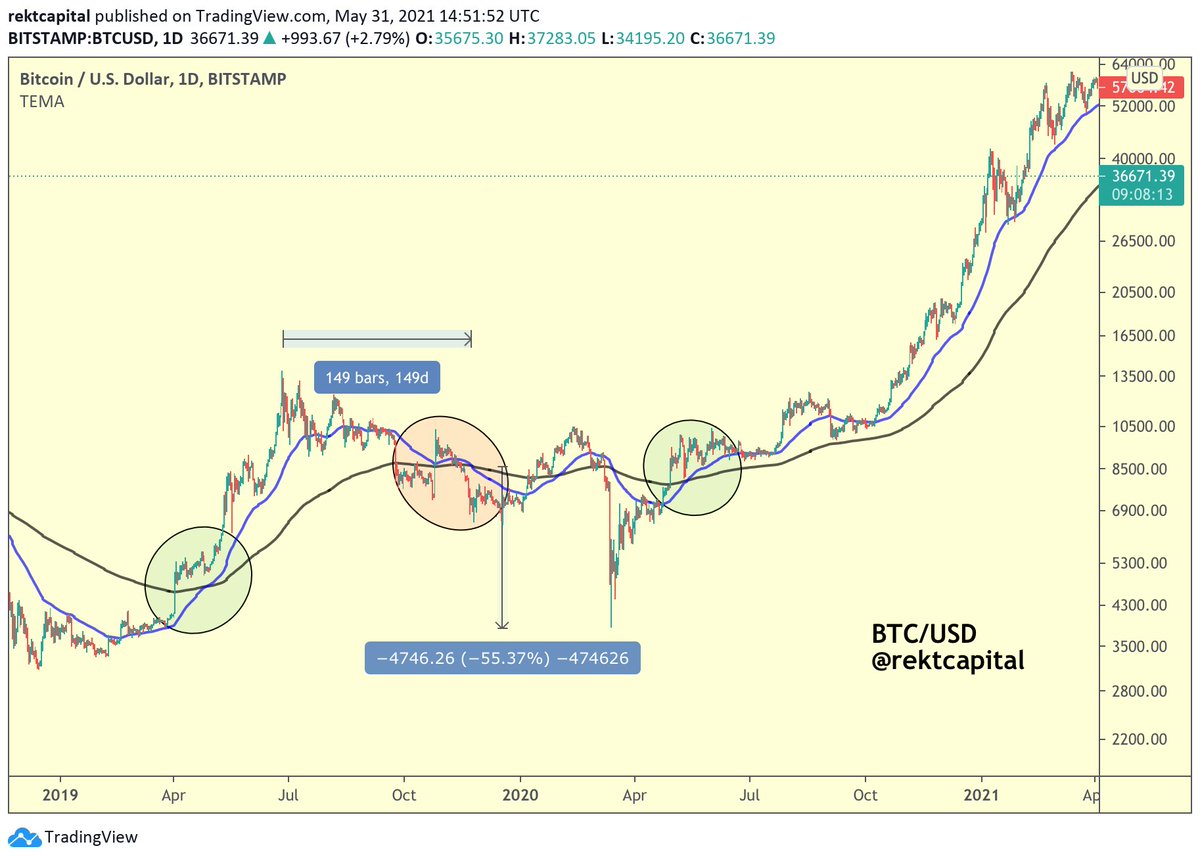
Let's now take a look at another historical Death Cross period:
When $BTC peaked in June 2019, it took 149 days for the Death Cross to occur
It took BTC 5 months to perform a Death Cross
But until that Death Cross occurred, #BTC's price had already dropped by -53%
Let's now take a look at another historical Death Cross period:
When $BTC peaked in June 2019, it took 149 days for the Death Cross to occur
It took BTC 5 months to perform a Death Cross
But until that Death Cross occurred, #BTC's price had already dropped by -53%
9.
But once the Death Cross took place, #BTC dropped an additional -55% to the downside
In sum when $BTC peaked in June 2019, BTC first dropped -53% before the Death Cross took place
And once that Death Cross occurred, an additional -55% retrace happened for #Bitcoin
But once the Death Cross took place, #BTC dropped an additional -55% to the downside
In sum when $BTC peaked in June 2019, BTC first dropped -53% before the Death Cross took place
And once that Death Cross occurred, an additional -55% retrace happened for #Bitcoin
10.
In sum, when $BTC peaked in June 2019...
Price had already dropped by -53% before the Death Cross
Once the Death Cross happened, #BTC retraced an extra -55% before bottoming in early 2020
Very similar retracement periods prior to and after the Death Crossover
In sum, when $BTC peaked in June 2019...
Price had already dropped by -53% before the Death Cross
Once the Death Cross happened, #BTC retraced an extra -55% before bottoming in early 2020
Very similar retracement periods prior to and after the Death Crossover


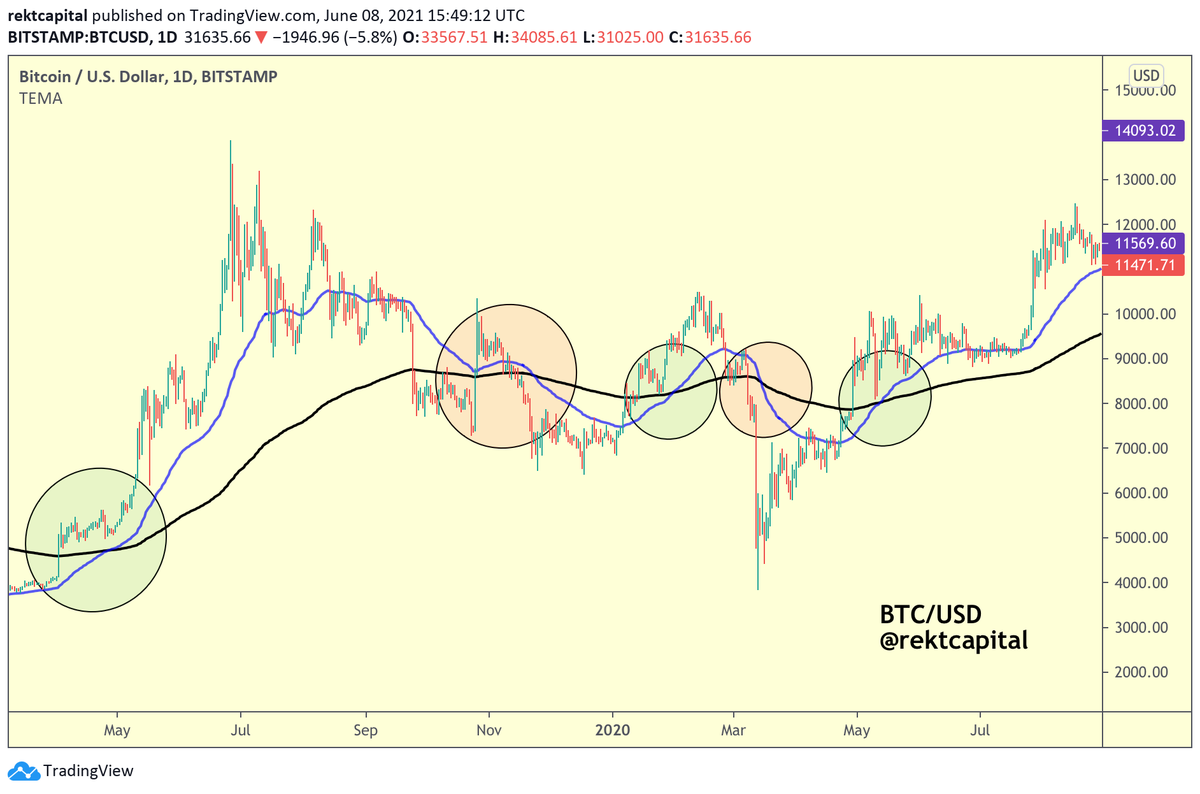
11.
Of course, a few DCs that occurred during late 2019 & early 2020 didn't precede much downside
In fact, the March 2020 DC marked out the generational bottom for #BTC
In a macro accumulation phase, EMAs tend to oscillate closely and perform trend-meaningless EMA crossovers
Of course, a few DCs that occurred during late 2019 & early 2020 didn't precede much downside
In fact, the March 2020 DC marked out the generational bottom for #BTC
In a macro accumulation phase, EMAs tend to oscillate closely and perform trend-meaningless EMA crossovers
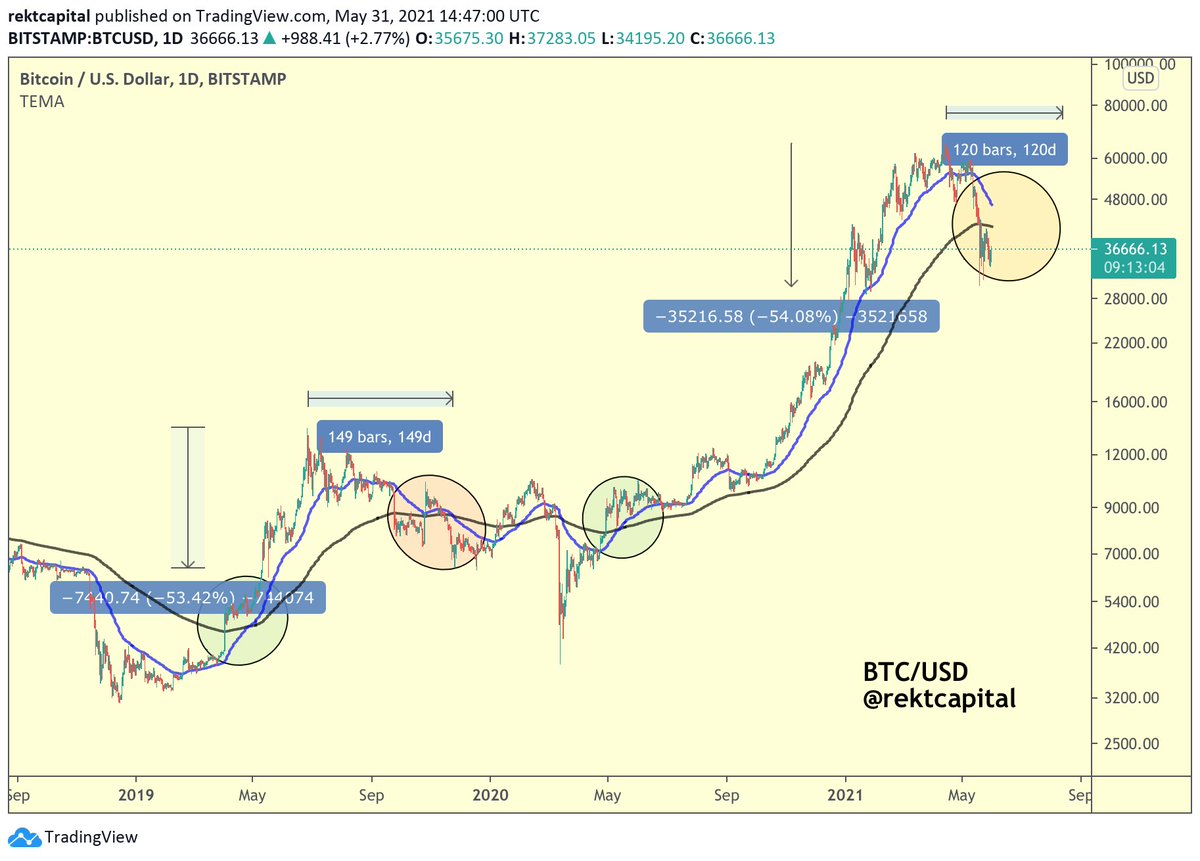
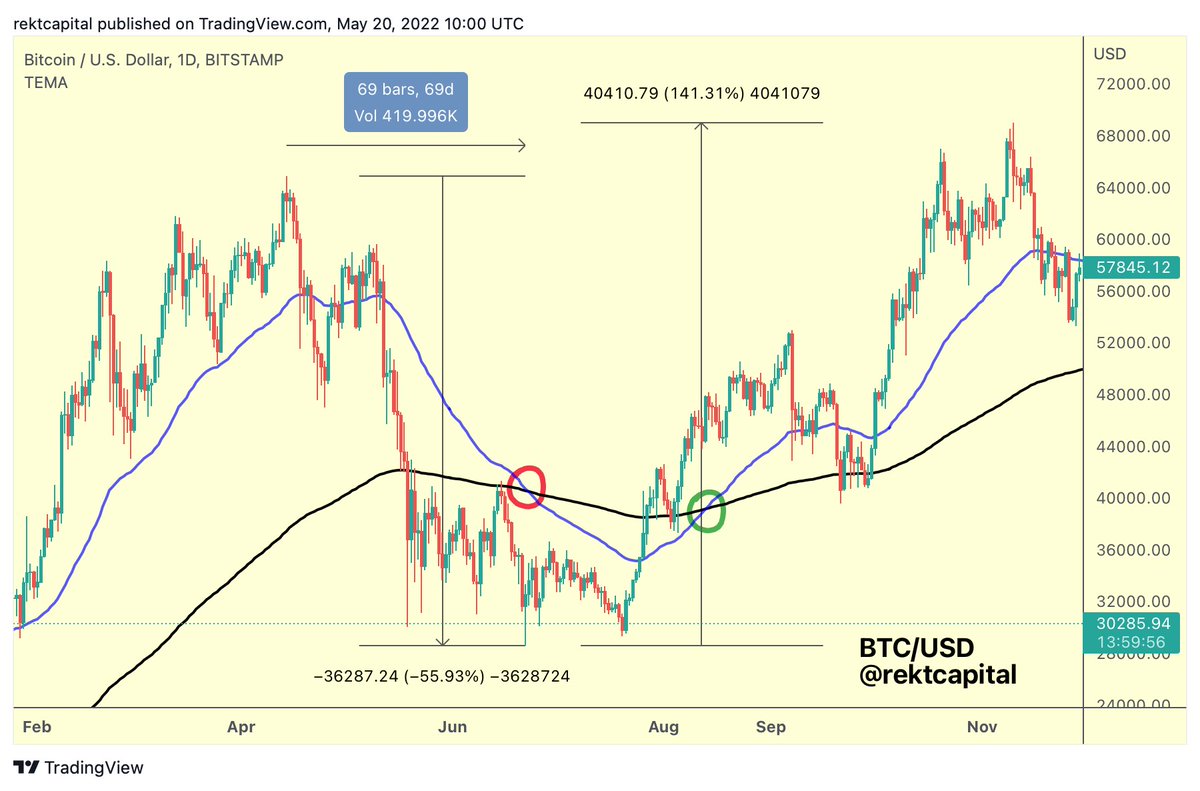
12.
Moreover, July 2021 once again showed that #BTC Death Crosses can precede generational bottoms
When $BTC peaked in May 2021, it took 69 days for the Death Cross to occur, a little over 3 months
But until that Death Cross occurred, BTC's price had already dropped by -55%
Moreover, July 2021 once again showed that #BTC Death Crosses can precede generational bottoms
When $BTC peaked in May 2021, it took 69 days for the Death Cross to occur, a little over 3 months
But until that Death Cross occurred, BTC's price had already dropped by -55%

13.
Firstly, the July 2021 #BTC Death Cross occurred 69 days after the May 2021 crash
That's much quicker than history would suggest
Historically, Death Crosses have occurred 107-135 days after the $BTC peak
But in July 2021, BTC actually rallied +141% after the Death Cross!
Firstly, the July 2021 #BTC Death Cross occurred 69 days after the May 2021 crash
That's much quicker than history would suggest
Historically, Death Crosses have occurred 107-135 days after the $BTC peak
But in July 2021, BTC actually rallied +141% after the Death Cross!

14.
In sum, when #BTC peaked in May 2021...
BTC had already dropped by -55% pre-Death Cross
But once the Death Cross occurred, it actually marked out a generational bottom for $BTC and rallied +141%
Much like in March 2020, the July 2021 Death Cross occurred at the bottom
In sum, when #BTC peaked in May 2021...
BTC had already dropped by -55% pre-Death Cross
But once the Death Cross occurred, it actually marked out a generational bottom for $BTC and rallied +141%
Much like in March 2020, the July 2021 Death Cross occurred at the bottom
15.
Therefore, March 2020 & July 2021 deviated from the historical tendency that suggests that #BTC Death Crosses tend to precede further deep downside
But it looks like the most recent January 2022 $BTC Death Cross is a return to form
Here's why...
#Crypto #Bitcoin
Therefore, March 2020 & July 2021 deviated from the historical tendency that suggests that #BTC Death Crosses tend to precede further deep downside
But it looks like the most recent January 2022 $BTC Death Cross is a return to form
Here's why...
#Crypto #Bitcoin
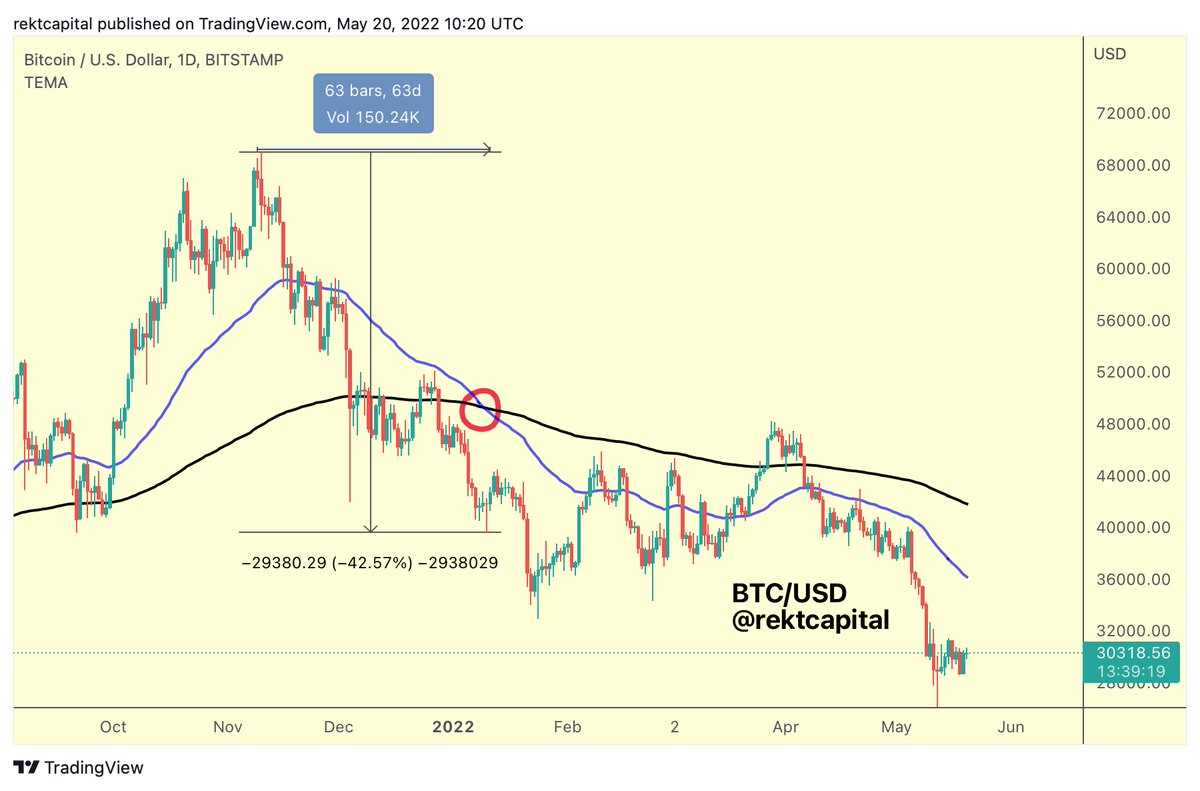
16.
Firstly, January '22 #BTC Death Cross occurred 63 days post BTC peak
Very similar to July '21 Death Cross which occurred 69 days post-peak
Historically $BTC Death Crosses 107-135 days post-peak
But both 2021 & 2022 show an acceleration in the time it takes to Death Cross
Firstly, January '22 #BTC Death Cross occurred 63 days post BTC peak
Very similar to July '21 Death Cross which occurred 69 days post-peak
Historically $BTC Death Crosses 107-135 days post-peak
But both 2021 & 2022 show an acceleration in the time it takes to Death Cross

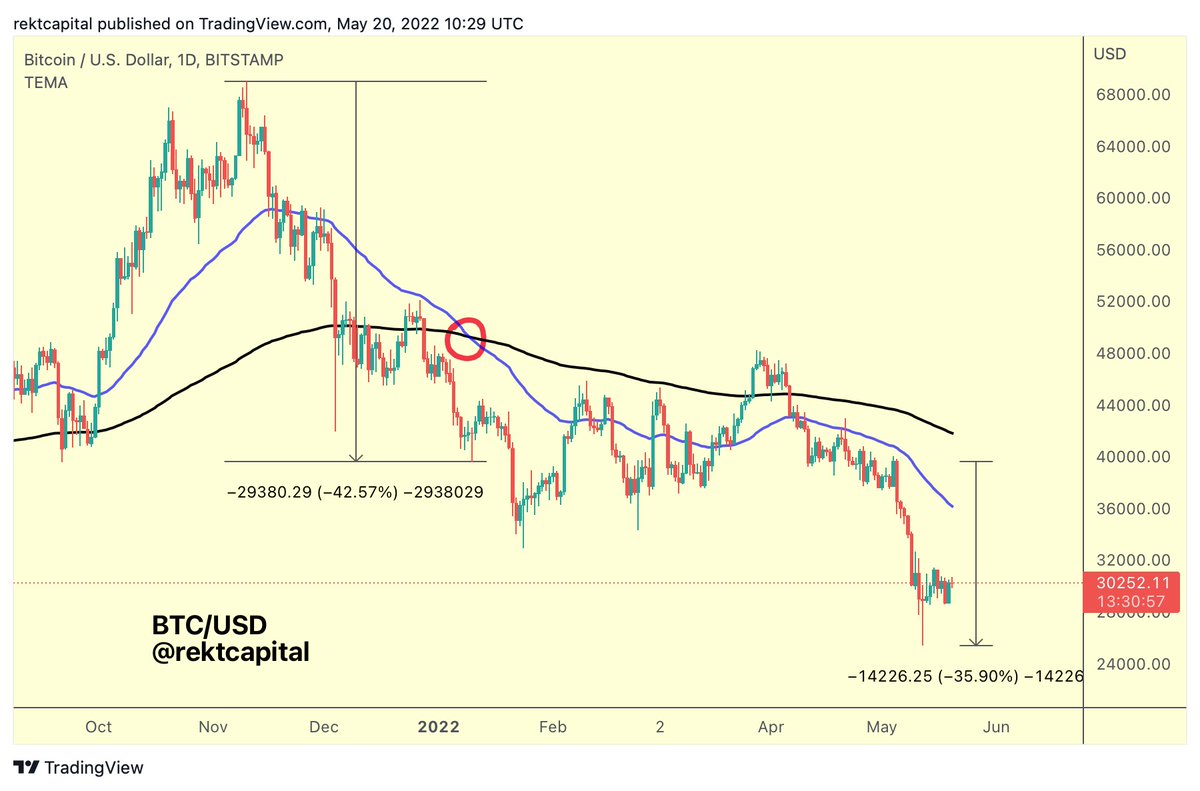
17.
Secondly but most importantly - the January '22 #BTC Death Cross has preceded deeper downside
$BTC is currently down almost -36% since the Death Cross
It looks like this Jan '22 Death Cross is back to respecting general historical Death Cross tendencies
#Bitcoin
Secondly but most importantly - the January '22 #BTC Death Cross has preceded deeper downside
$BTC is currently down almost -36% since the Death Cross
It looks like this Jan '22 Death Cross is back to respecting general historical Death Cross tendencies
#Bitcoin

18.
So what could this mean for #BTC going forward?
To answer that question, let's keep in mind the following key Death Cross tendency:
"More often than not, the depth of a $BTC correction pre-Death Cross is similar to retrace depth post-Death Cross"
#Crypto #Bitcoin
So what could this mean for #BTC going forward?
To answer that question, let's keep in mind the following key Death Cross tendency:
"More often than not, the depth of a $BTC correction pre-Death Cross is similar to retrace depth post-Death Cross"
#Crypto #Bitcoin
19.
Summary:
2013:
• #BTC drops -73% pre-Death Cross
• BTC drops extra -70% post-DC
2017:
• -70% pre-DC
• -65% post-DC
2019:
• -53% pre-DC
• -55% post-DC
2020:
• -63% pre-DC
• +1581% post-DC
2021:
• -56% pre-DC
• +141% post-DC
2022:
• -43% pre-DC
• ? post-DC
Summary:
2013:
• #BTC drops -73% pre-Death Cross
• BTC drops extra -70% post-DC
2017:
• -70% pre-DC
• -65% post-DC
2019:
• -53% pre-DC
• -55% post-DC
2020:
• -63% pre-DC
• +1581% post-DC
2021:
• -56% pre-DC
• +141% post-DC
2022:
• -43% pre-DC
• ? post-DC
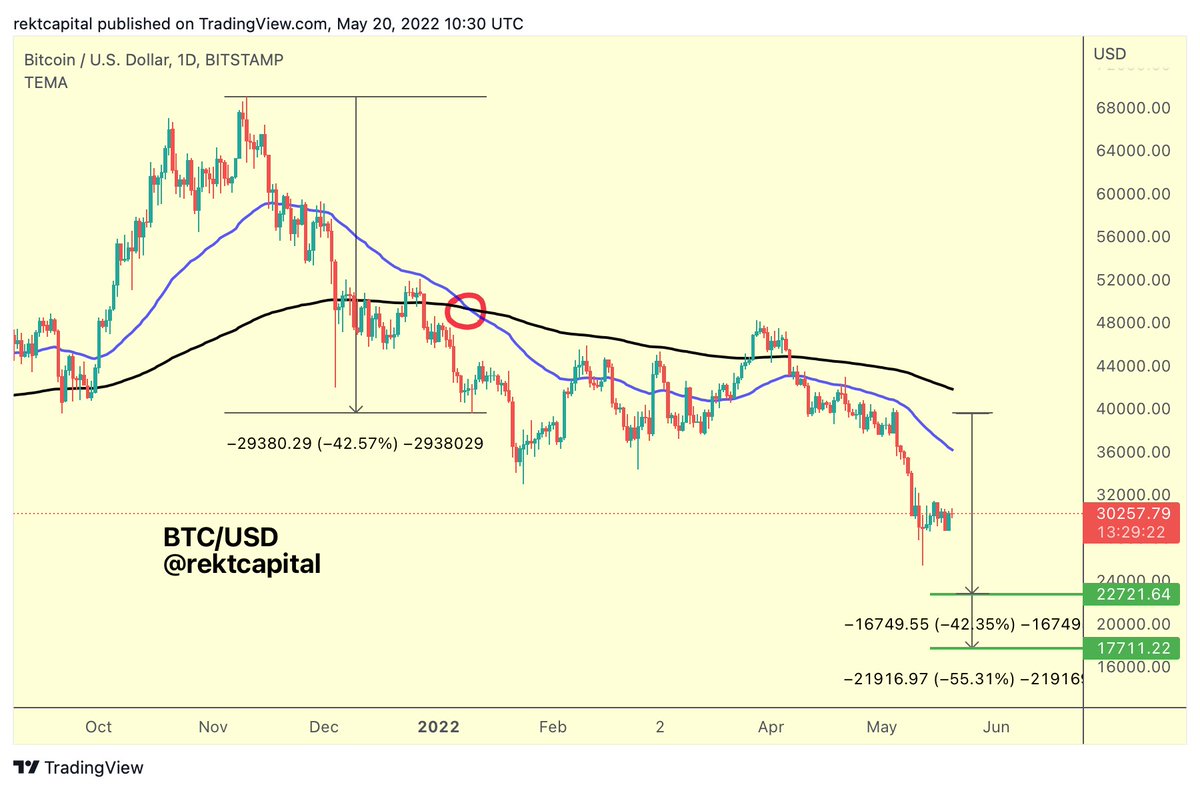
20.
So since #BTC has crashed -43% since November '21 prior to the Death Cross...
$BTC could retrace a bit more to reach an overall retracement of -43% post-Death Cross, should this historical tendency continue to repeat
This would result in a ~$22,700 $BTC
#Crypto #Bitcoin
So since #BTC has crashed -43% since November '21 prior to the Death Cross...
$BTC could retrace a bit more to reach an overall retracement of -43% post-Death Cross, should this historical tendency continue to repeat
This would result in a ~$22,700 $BTC
#Crypto #Bitcoin
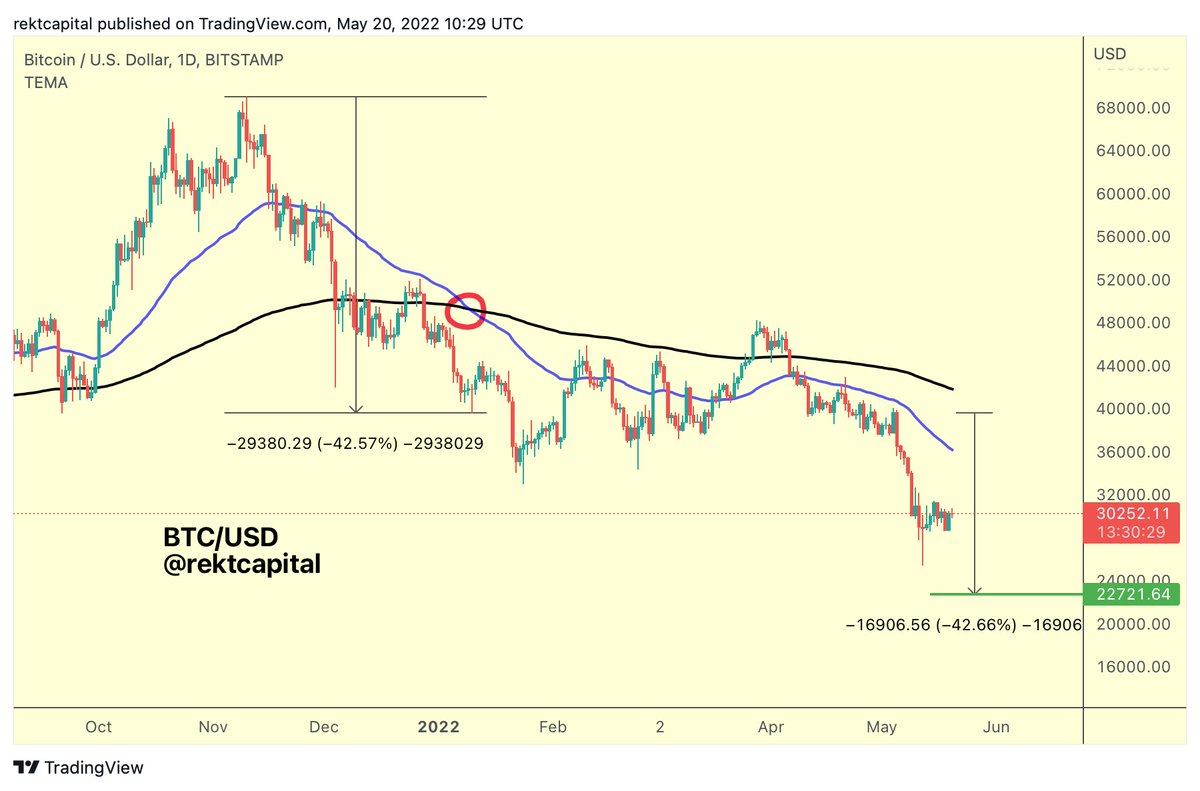
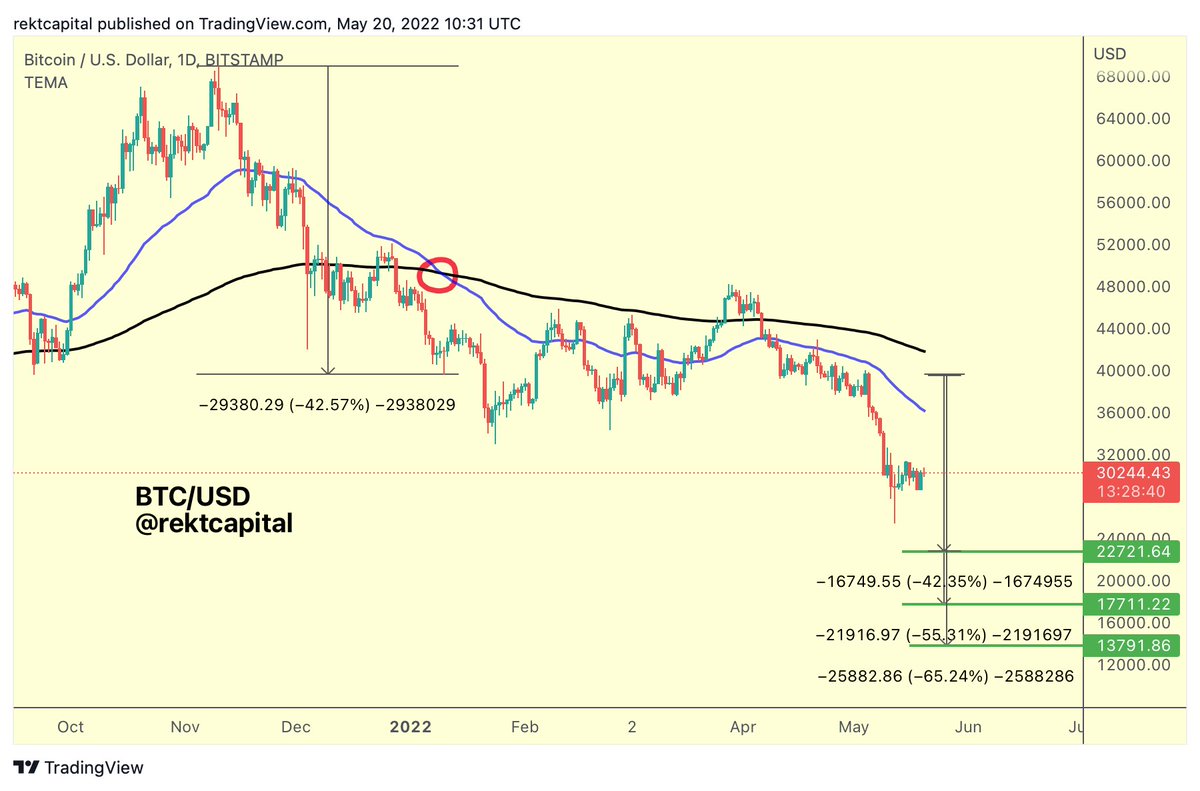
21.
This would suggest that the #BTC bottom is not yet in
But let's go one step further for the sake of discourse
$BTC has crashed -55%, -65%, and -71% after a Death Cross in the past
What if history were to repeat itself with a -55% crash?
#Bitcoin would bottom at ~$18000
This would suggest that the #BTC bottom is not yet in
But let's go one step further for the sake of discourse
$BTC has crashed -55%, -65%, and -71% after a Death Cross in the past
What if history were to repeat itself with a -55% crash?
#Bitcoin would bottom at ~$18000
22.
What price point would #BTC reach if BTC were to repeat a -65% crash post-Death Cross?
This would result in a ~$13,800 $BTC
#Crypto #Bitcoin
What price point would #BTC reach if BTC were to repeat a -65% crash post-Death Cross?
This would result in a ~$13,800 $BTC
#Crypto #Bitcoin
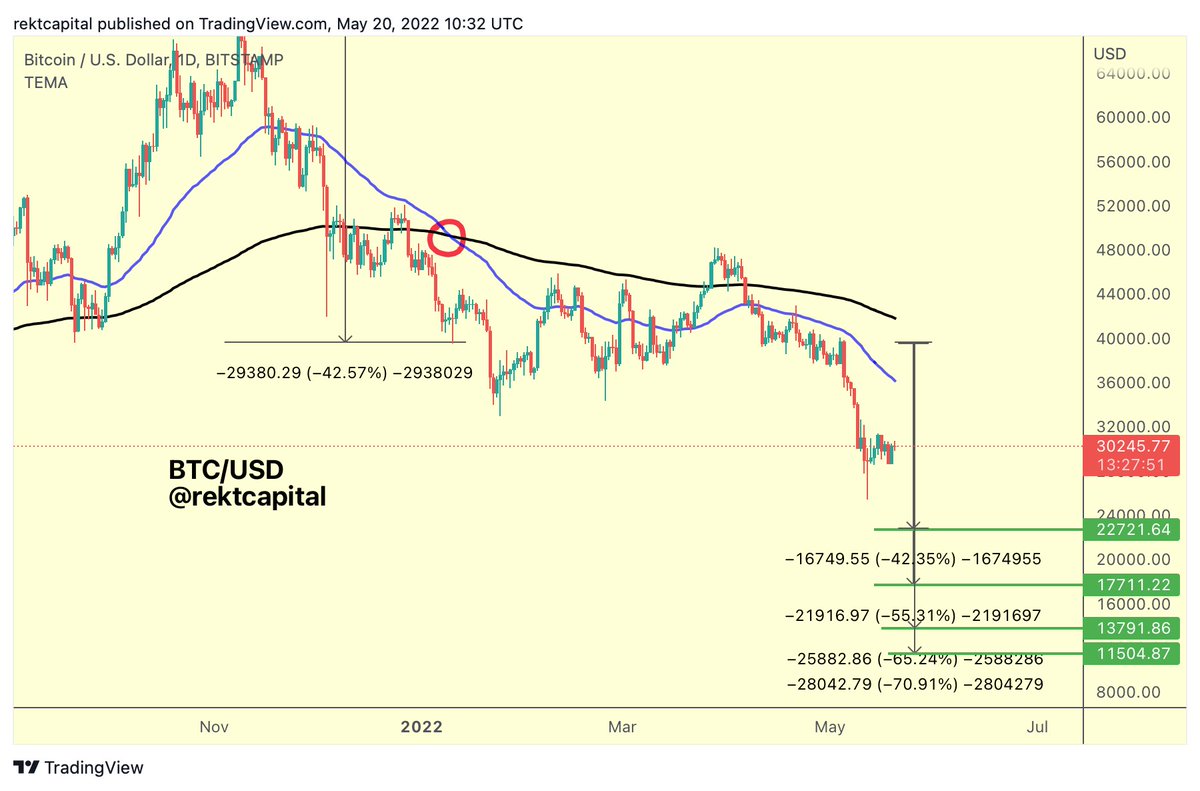
23.
And what would #BTC reach if BTC were to repeat a -71% crash post-Death Cross?
This would result in a ~$11,500 $BTC
Curiously, a retracement would constitute a -84.5% correction from the overall November 2021 peak
An -84.5% correction is an average Bear Market correction
And what would #BTC reach if BTC were to repeat a -71% crash post-Death Cross?
This would result in a ~$11,500 $BTC
Curiously, a retracement would constitute a -84.5% correction from the overall November 2021 peak
An -84.5% correction is an average Bear Market correction
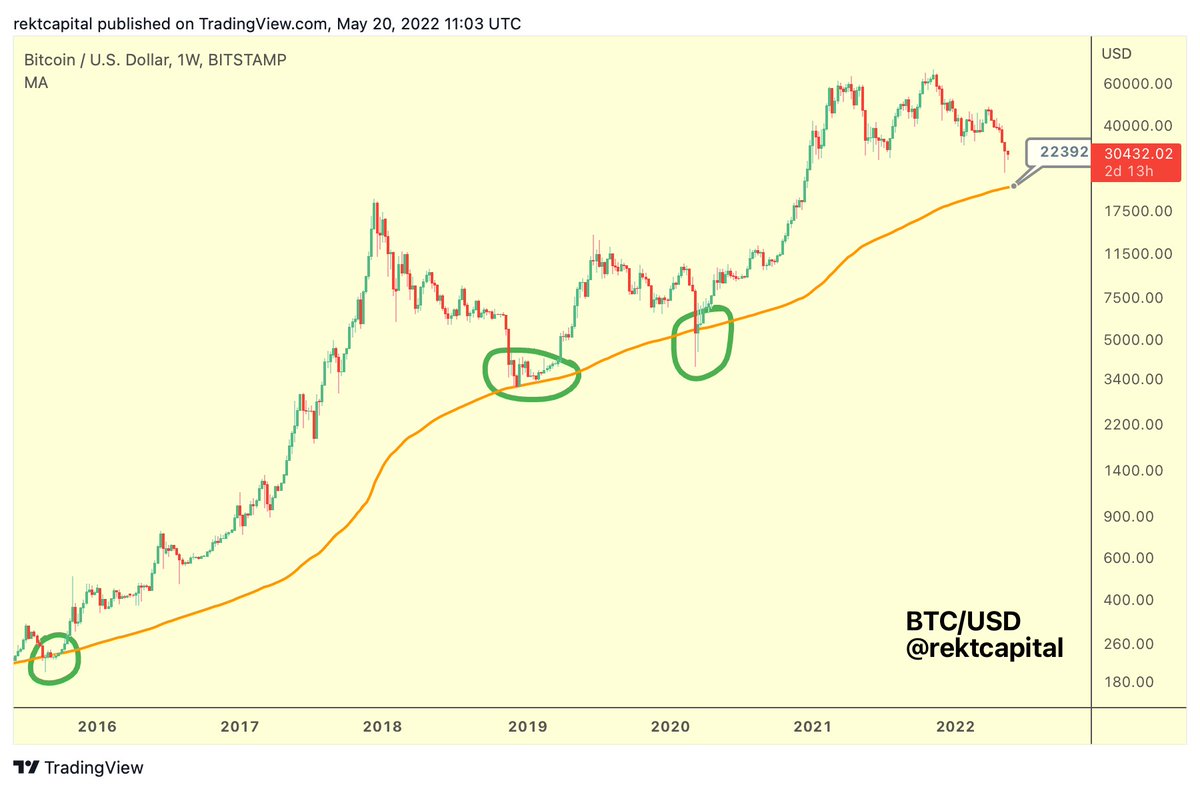
24.
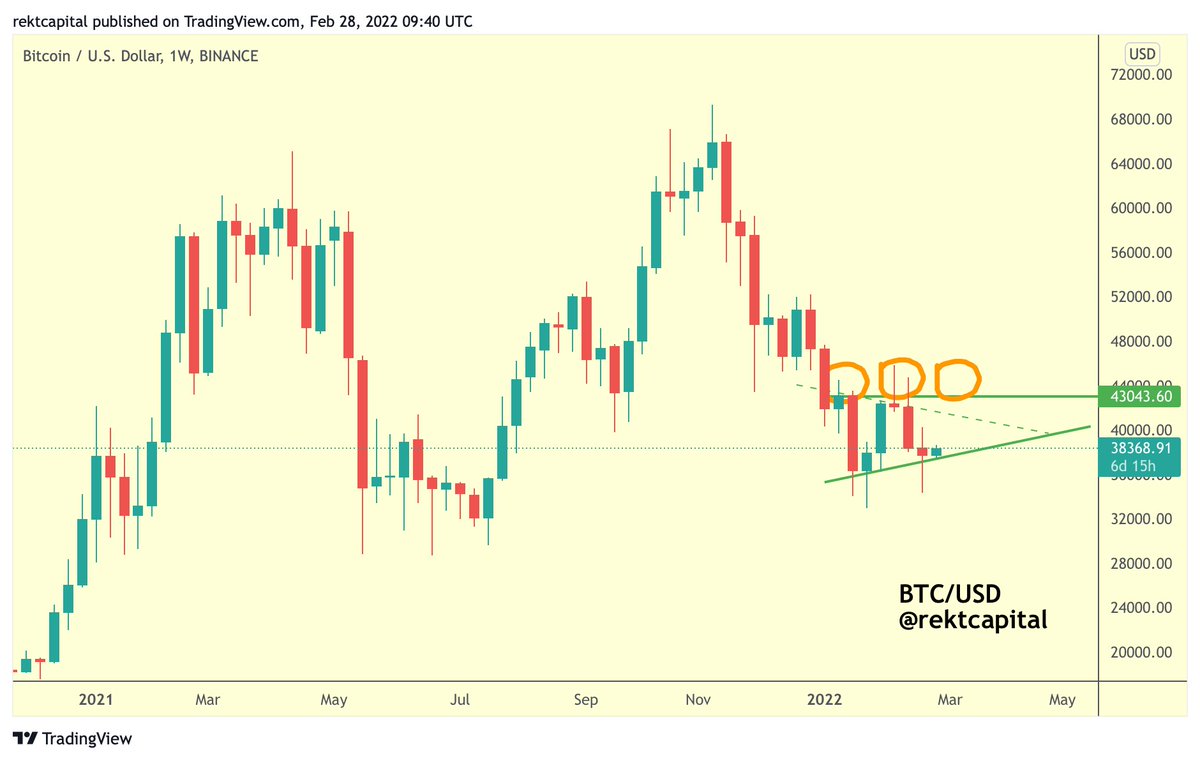
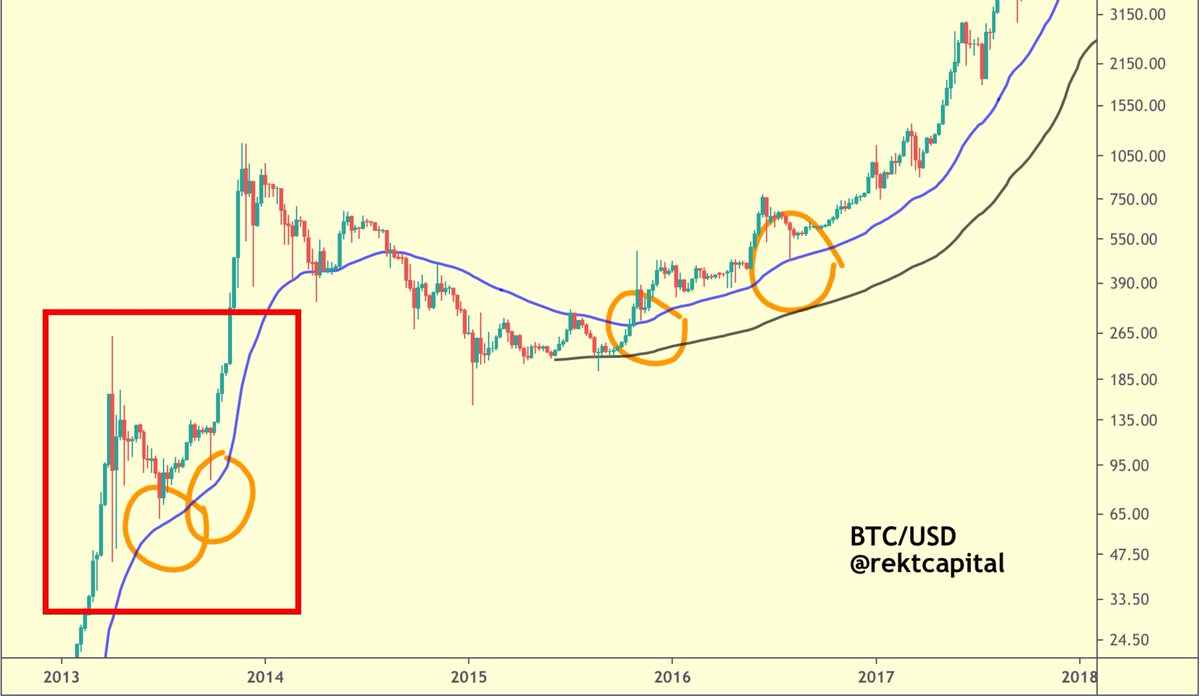
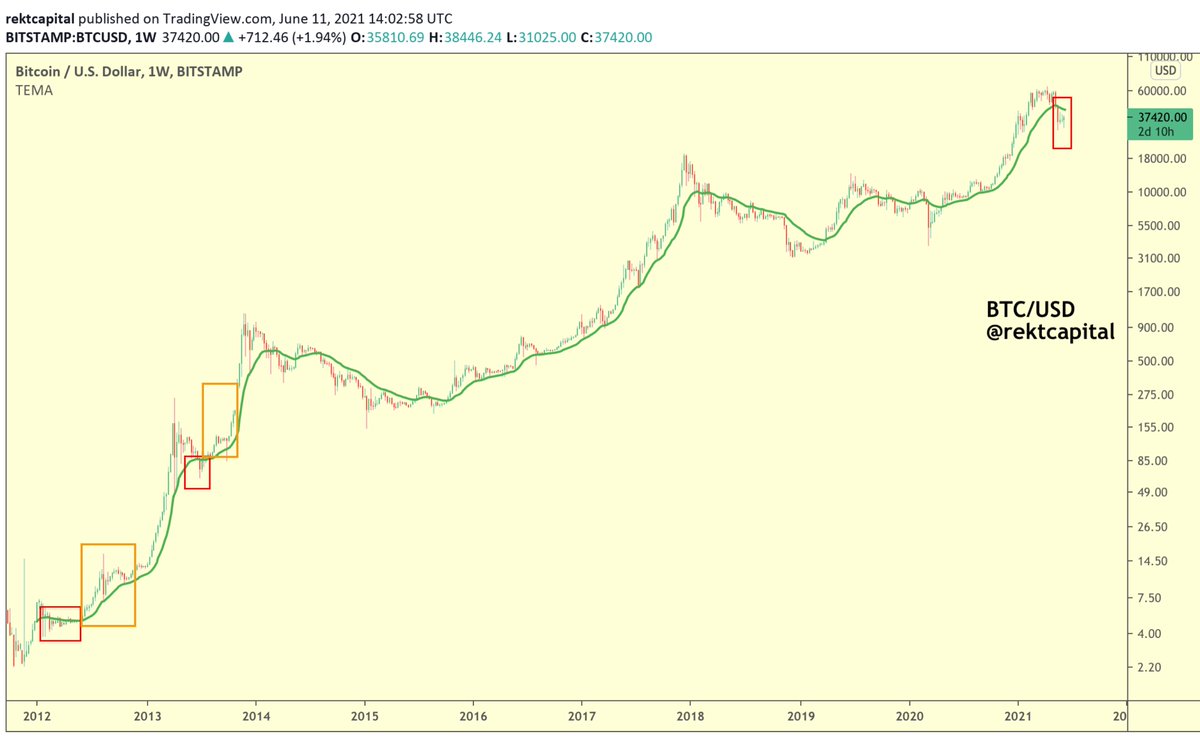
What's interesting about the scenario of a -43% post-Death Cross crash however is that it would result in a $22000 #BTC
Which ties in with the 200-SMA (orange) which tends to offer fantastic opportunities with outsized ROI for $BTC investors (green circles highlight this)
What's interesting about the scenario of a -43% post-Death Cross crash however is that it would result in a $22000 #BTC
Which ties in with the 200-SMA (orange) which tends to offer fantastic opportunities with outsized ROI for $BTC investors (green circles highlight this)
25.
This type of extensive analysis is something I tend to share in the Rekt Capital Newsletter
If you liked this thread - you'll love the newsletter
Feel free to sign up for regular cutting-edge insights on #BTC and Altcoins:
rektcapital.substack.com
$BTC #Crypto #Bitcoin
This type of extensive analysis is something I tend to share in the Rekt Capital Newsletter
If you liked this thread - you'll love the newsletter
Feel free to sign up for regular cutting-edge insights on #BTC and Altcoins:
rektcapital.substack.com
$BTC #Crypto #Bitcoin
• • •
Missing some Tweet in this thread? You can try to
force a refresh