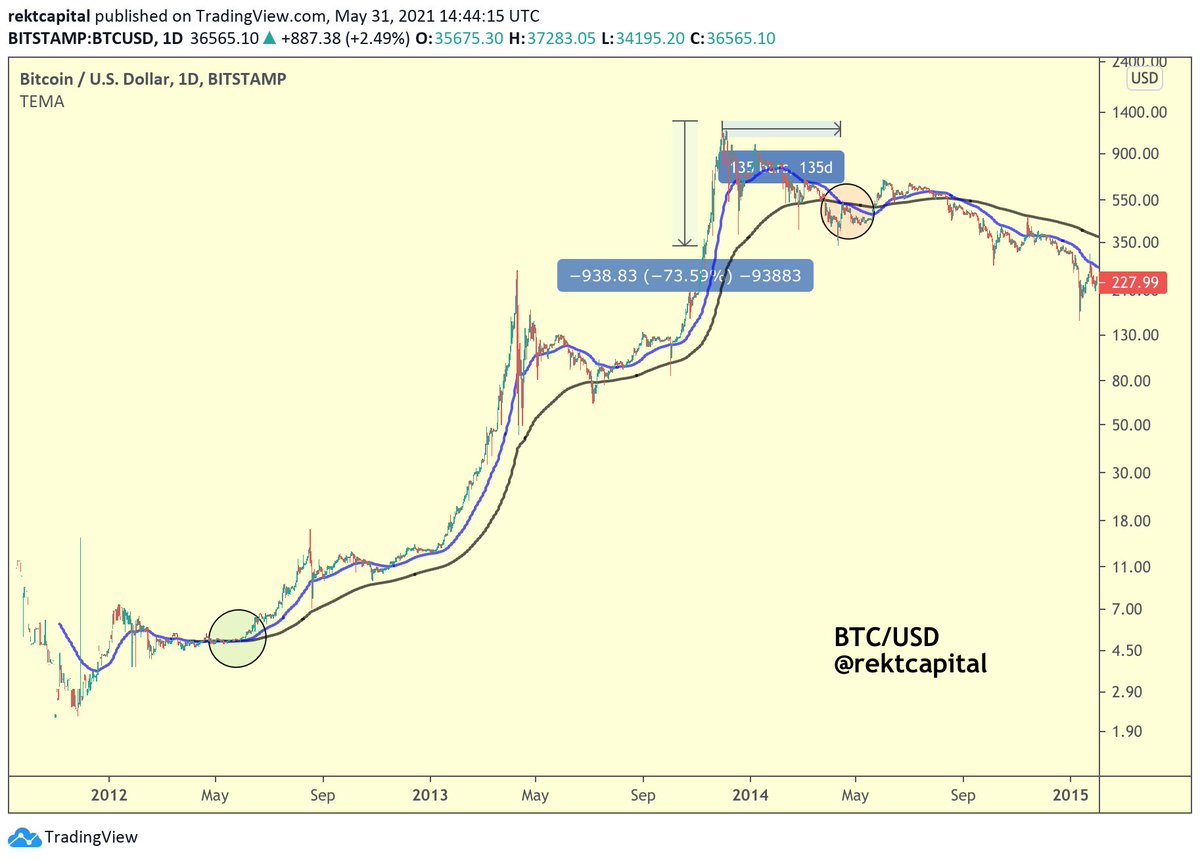
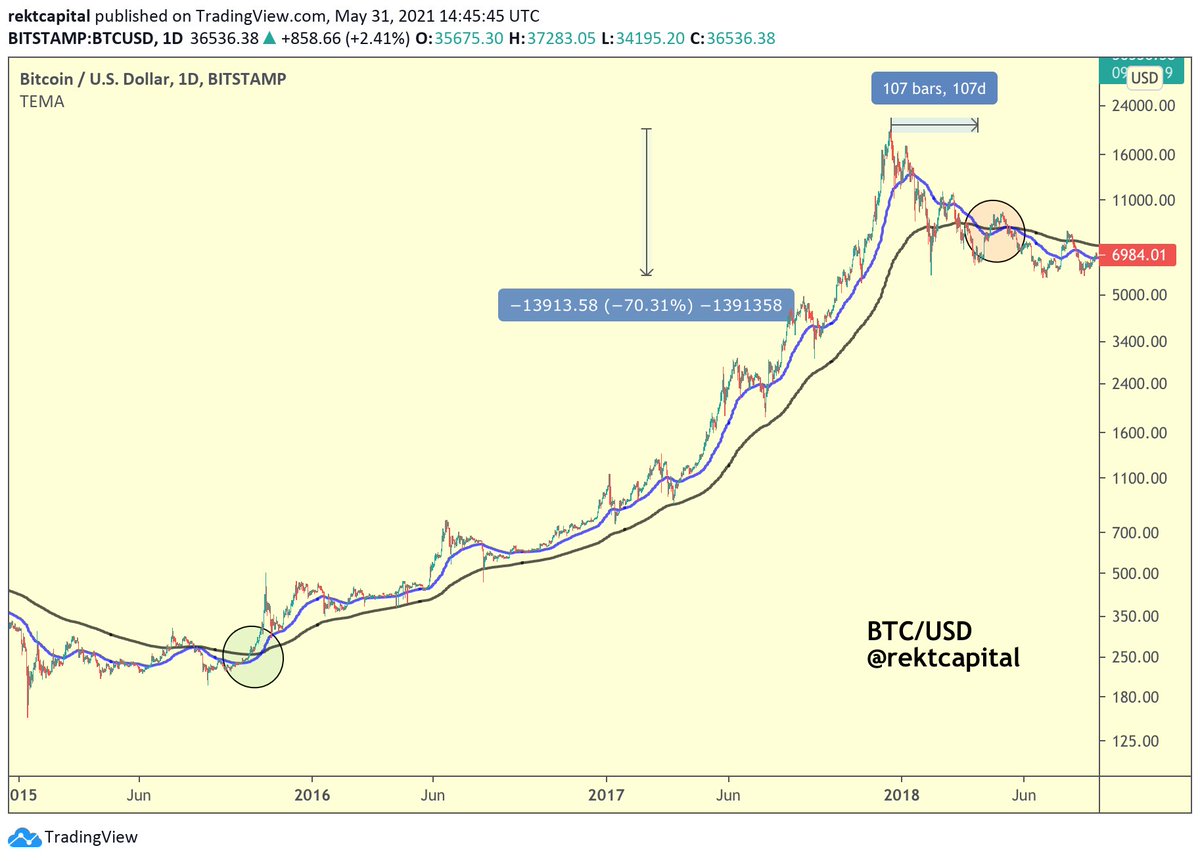
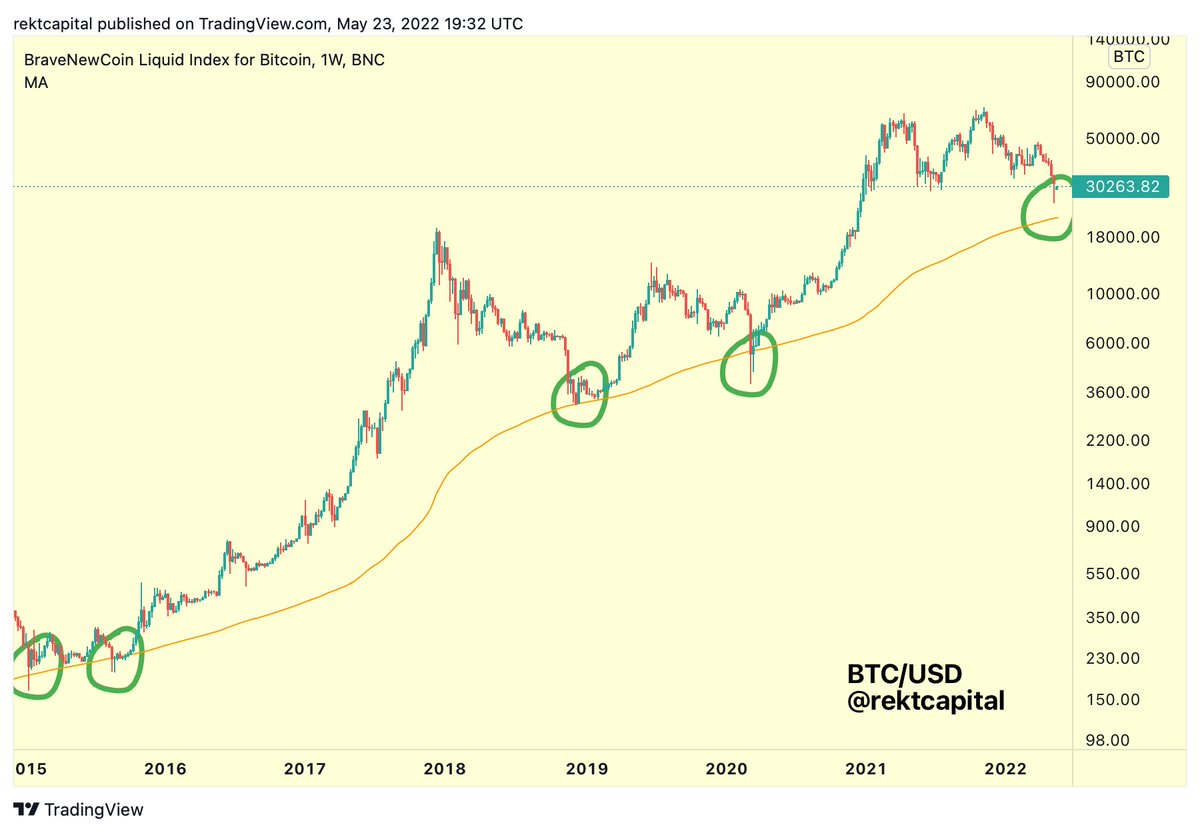
Historically, #BTC tends to bottom at or below the 200-MA (orange)
The 200-MA thus tends to offer opportunities with outsized ROI for $BTC investors (green)
Wicks below it are the point of peak opportunity
So how much does BTC wick below the 200-MA?
A thread
#Crypto #Bitcoin
The 200-MA thus tends to offer opportunities with outsized ROI for $BTC investors (green)
Wicks below it are the point of peak opportunity
So how much does BTC wick below the 200-MA?
A thread
#Crypto #Bitcoin

1.
Downside wicks below the 200-MA represent peak financial opportunity for long-term #BTC investors
But these downside wicks also represent Extreme Fear and Maximum Pessimism in market sentiment
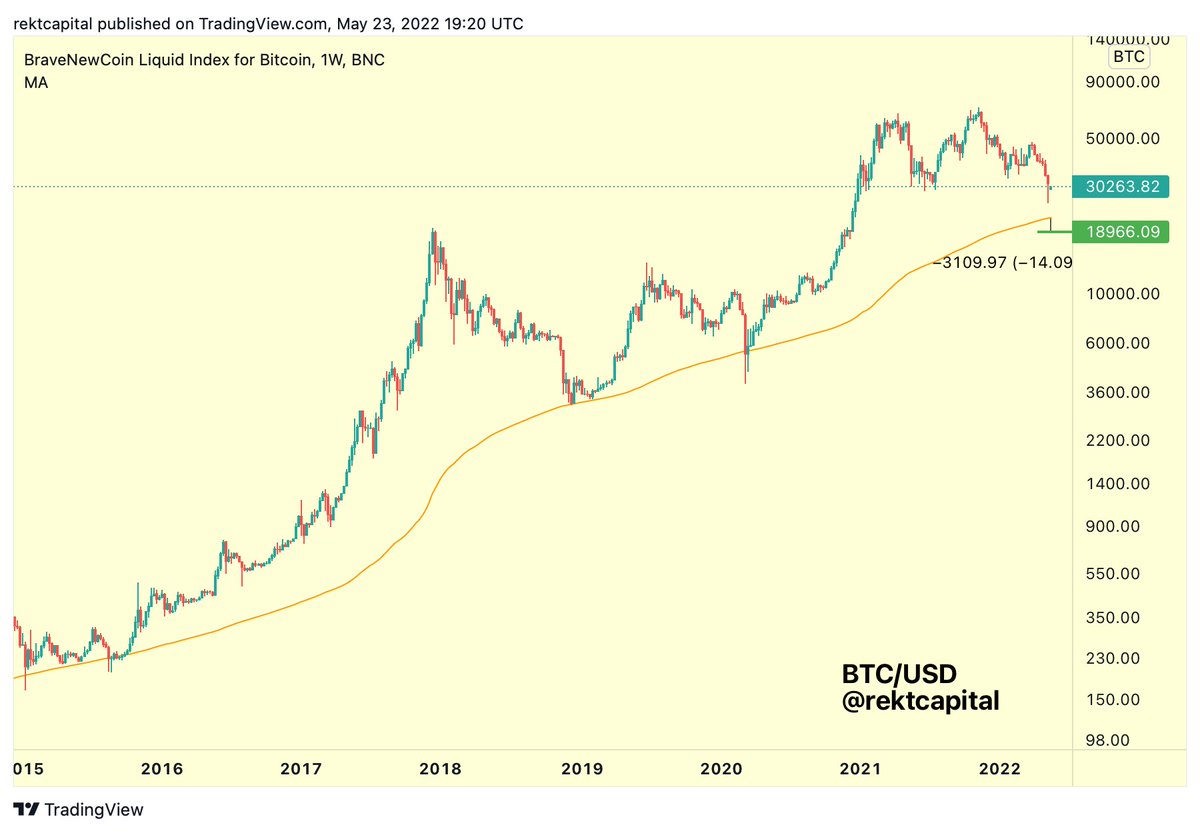
In early 2015, $BTC downside wicked below the 200-MA by -14%
#Crypto #Bitcoin
Downside wicks below the 200-MA represent peak financial opportunity for long-term #BTC investors
But these downside wicks also represent Extreme Fear and Maximum Pessimism in market sentiment
In early 2015, $BTC downside wicked below the 200-MA by -14%
#Crypto #Bitcoin

3.
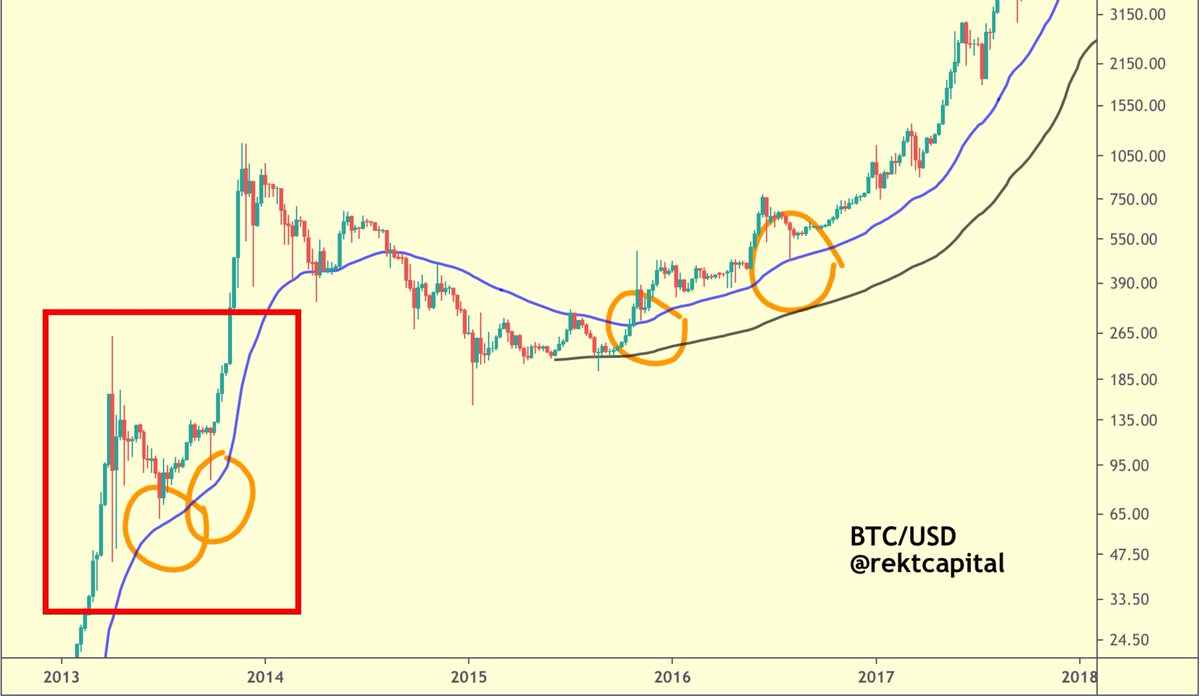
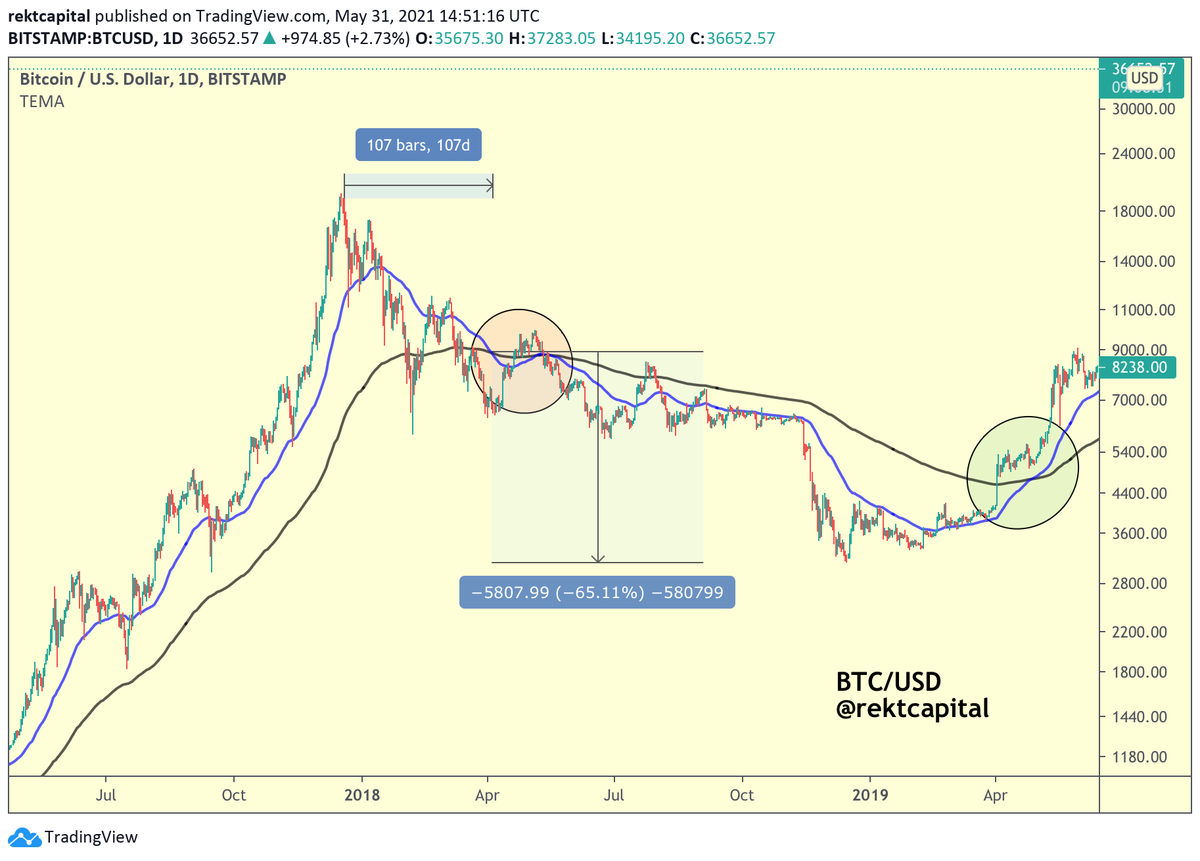
In 2017/2018, #BTC actually formed a generational bottom precisely at the 200-MA support
No downside wicks below the MA occurred
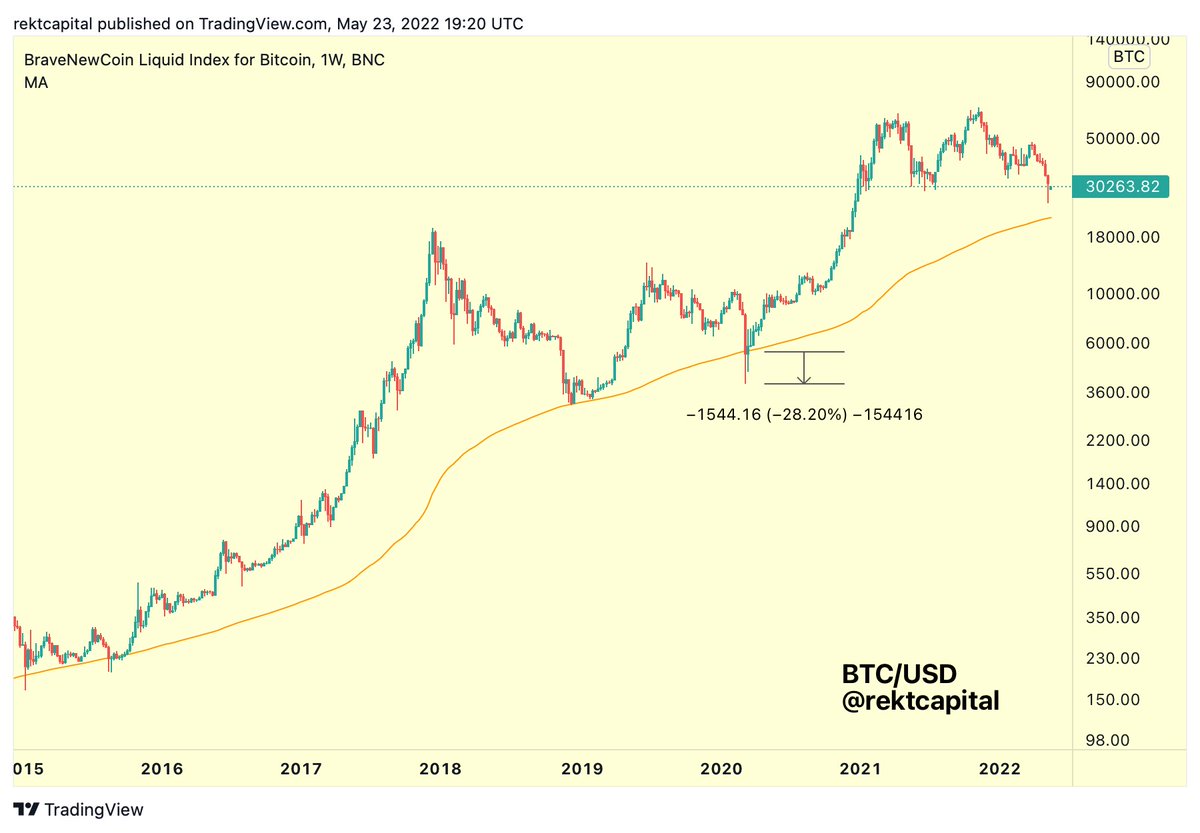
However in March 2020, $BTC downside wicked below the 200-MA by -28%
#Crypto #Bitcoin
In 2017/2018, #BTC actually formed a generational bottom precisely at the 200-MA support
No downside wicks below the MA occurred
However in March 2020, $BTC downside wicked below the 200-MA by -28%
#Crypto #Bitcoin
4.
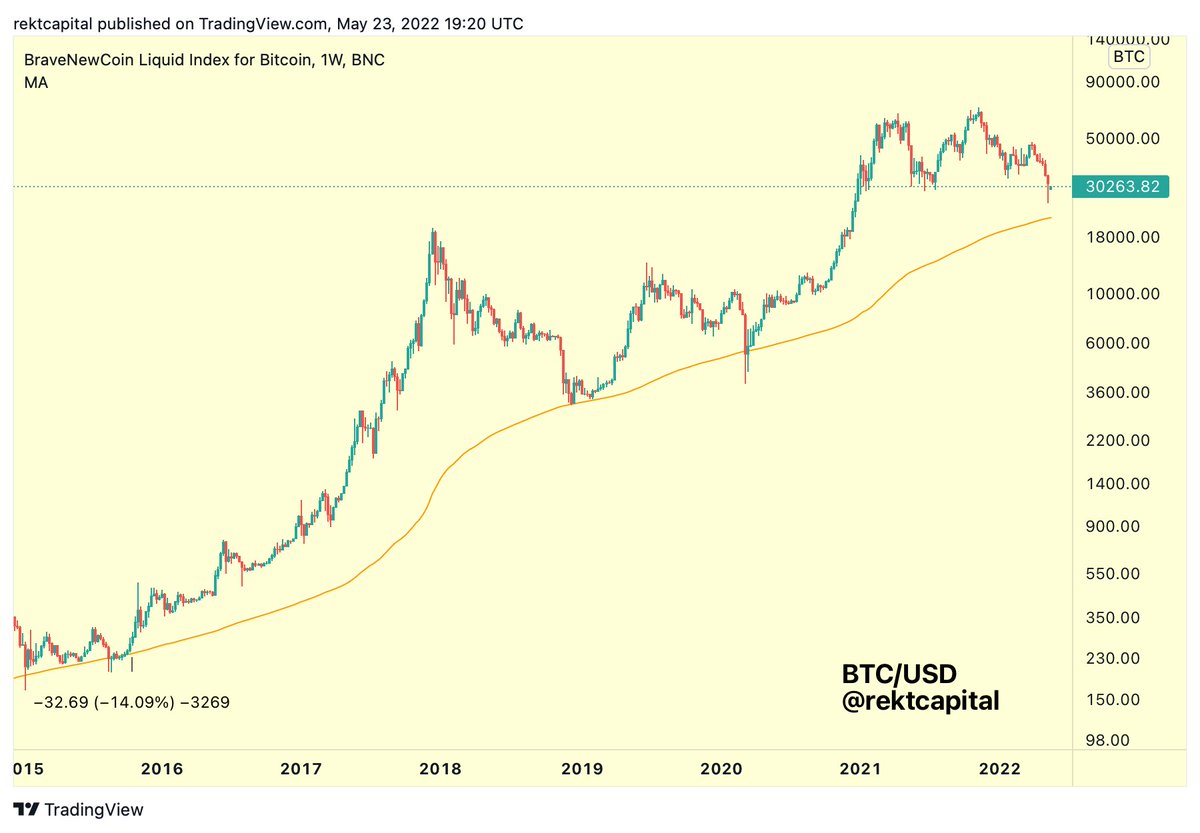
Historically, #BTC tends to perform downside wicks below the 200-MA
These $BTC downside wicks represent peak financial opportunity for long-term investors
These wicks tend to be -14% to -28% deep
#Crypto #Bitcoin
Historically, #BTC tends to perform downside wicks below the 200-MA
These $BTC downside wicks represent peak financial opportunity for long-term investors
These wicks tend to be -14% to -28% deep
#Crypto #Bitcoin

5.
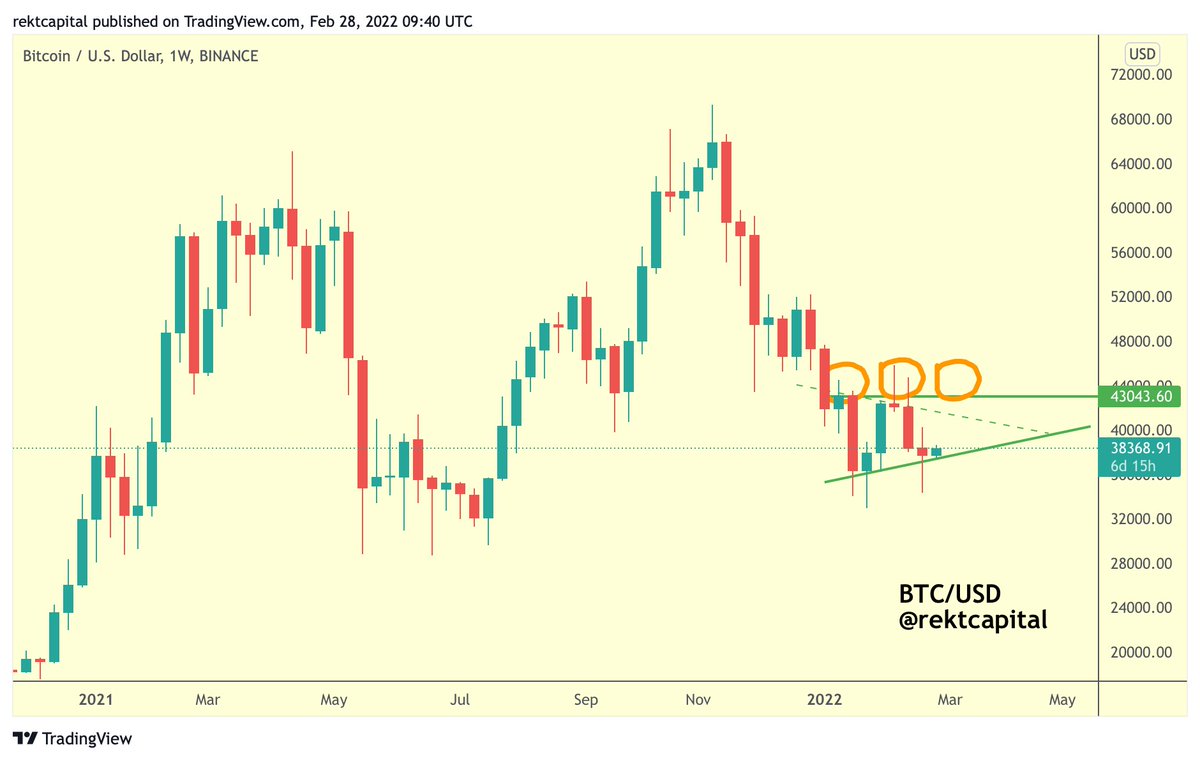
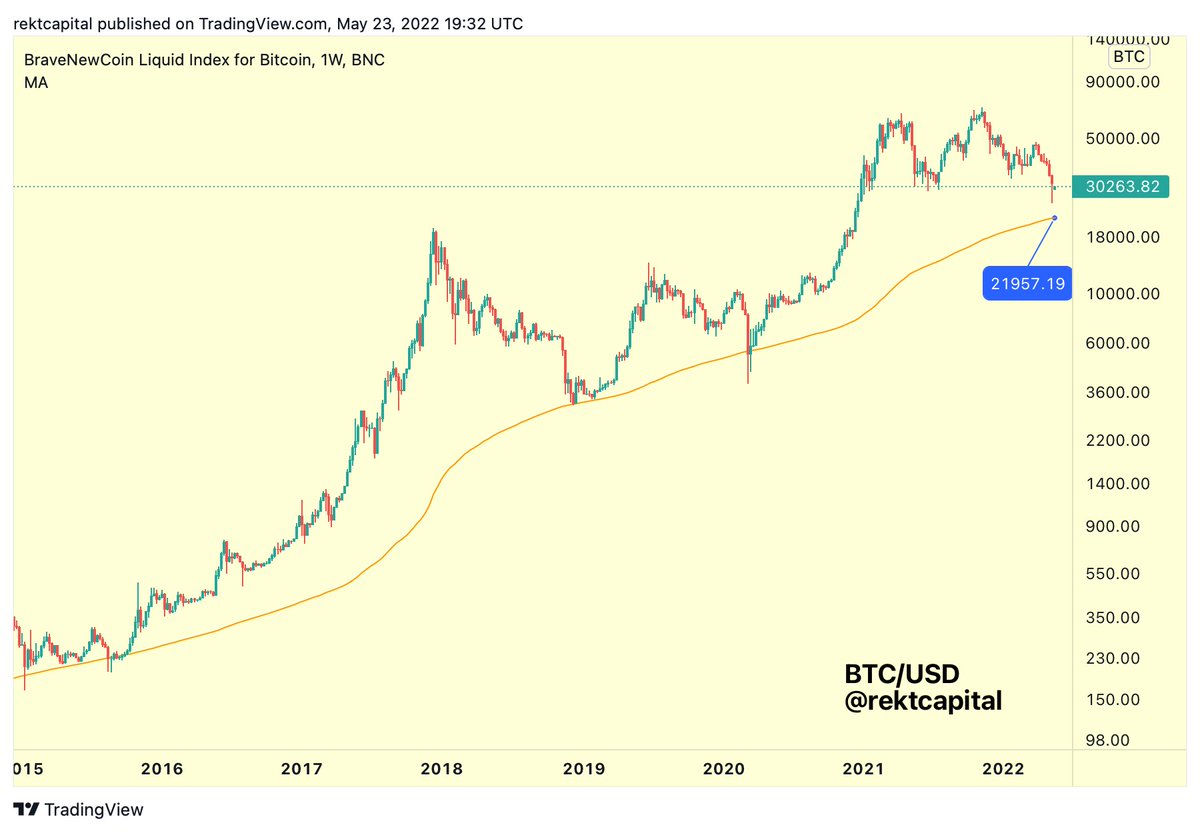
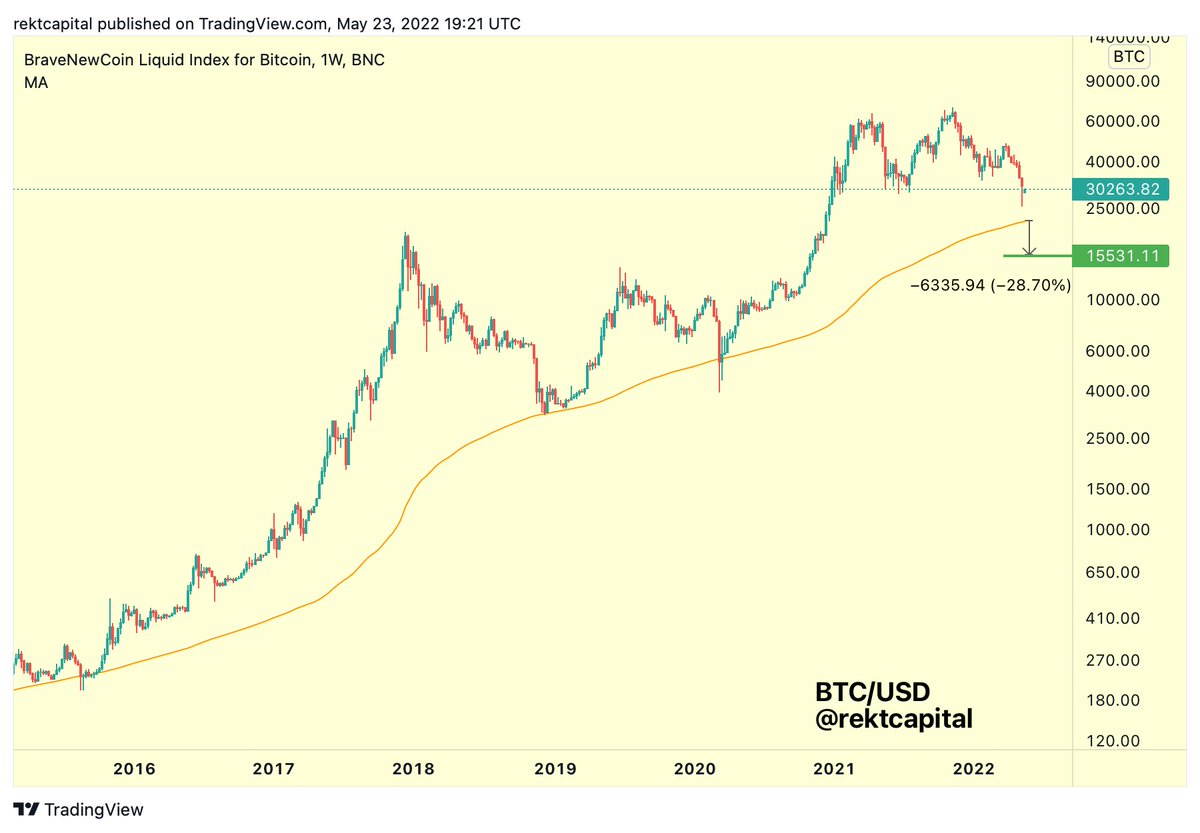
At the time of this thread, the 200-MA for #BTC represents a price point of ~$22000
Price has not yet reached the 200-MA support
$BTC #Crypto #Bitcoin
At the time of this thread, the 200-MA for #BTC represents a price point of ~$22000
Price has not yet reached the 200-MA support
$BTC #Crypto #Bitcoin
6.
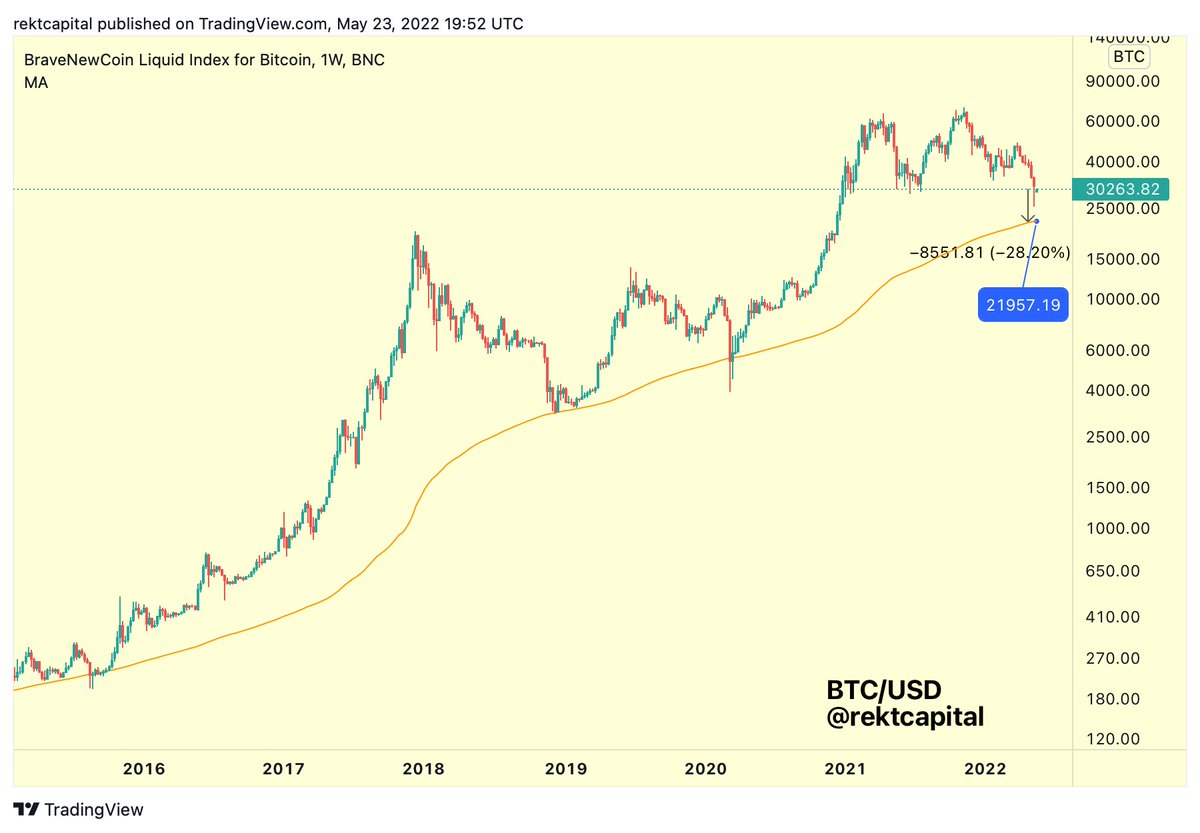
In fact, #BTC would need to drop at least an additional -28% from current prices to bottom at the 200-SMA
$BTC #Crypto #Bitcoin
In fact, #BTC would need to drop at least an additional -28% from current prices to bottom at the 200-SMA
$BTC #Crypto #Bitcoin
7.
If #BTC reaches the 200-MA support in the coming months...
Could $BTC perform a downside wick below it?
Since 2015, the 200-MA has been touched on 4 occasions to form generational Bear Market bottoms
And 3 out of 4 of those Bear Market bottoms ended with downside wicking
If #BTC reaches the 200-MA support in the coming months...
Could $BTC perform a downside wick below it?
Since 2015, the 200-MA has been touched on 4 occasions to form generational Bear Market bottoms
And 3 out of 4 of those Bear Market bottoms ended with downside wicking

8.
#BTC tends to wick -14% to -28% below the 200-MA
And since the $BTC 200-MA now represents the price point of ~$22000...
A -14% downside wick below the 200-MA would result in a ~$19000 Bitcoin
#Crypto #Bitcoin
#BTC tends to wick -14% to -28% below the 200-MA
And since the $BTC 200-MA now represents the price point of ~$22000...
A -14% downside wick below the 200-MA would result in a ~$19000 Bitcoin
#Crypto #Bitcoin
9.
And if #BTC were to repeat the March 2020 downside wicking depth below the 200-MA
$BTC would revisit the ~$15500 price point
#Crypto #Bitcoin
And if #BTC were to repeat the March 2020 downside wicking depth below the 200-MA
$BTC would revisit the ~$15500 price point
#Crypto #Bitcoin
10.
#BTC is slowly approaching the 200-MA
Historically, the 200-MA tends to offer fantastic opportunities with outsized ROI for long-term $BTC investors (green circles)
Should BTC indeed reach the 200-MA support...
It would be wise to pay attention
#Crypto #Bitcoin
#BTC is slowly approaching the 200-MA
Historically, the 200-MA tends to offer fantastic opportunities with outsized ROI for long-term $BTC investors (green circles)
Should BTC indeed reach the 200-MA support...
It would be wise to pay attention
#Crypto #Bitcoin
11.
I usually share this type of level-headed, unbiased analysis in the Rekt Capital Newsletter
If you liked this thread - you'll love the newsletter
Feel free to sign up for regular cutting-edge insights on #BTC and Altcoins:
rektcapital.substack.com
$BTC #Crypto #Bitcoin
I usually share this type of level-headed, unbiased analysis in the Rekt Capital Newsletter
If you liked this thread - you'll love the newsletter
Feel free to sign up for regular cutting-edge insights on #BTC and Altcoins:
rektcapital.substack.com
$BTC #Crypto #Bitcoin
• • •
Missing some Tweet in this thread? You can try to
force a refresh