
Breakout (BO) is a very popular technique among traders and investors who like to make their living out of stock market
If you love to trade momentum then here is everything you need to know about breakout trading, through live examples
A Thread
#trading #investing #finance
If you love to trade momentum then here is everything you need to know about breakout trading, through live examples
A Thread
#trading #investing #finance

1/ Pre-Breakout Talk
We know that stocks do not move up/down in a straight line. They often pause to regain energy before resuming for a next strong move. During this phase many buyers and sellers exchange hands.
We know that stocks do not move up/down in a straight line. They often pause to regain energy before resuming for a next strong move. During this phase many buyers and sellers exchange hands.
The price often squeezes in a range with declining volatility and low trading volumes

Buyers, if still bullish, utilize this opportunity to accumulate more. As soon as there is enough accumulation, the stock breaks the range and expands in the direction of trend.
The price action may constraint itself in a variety of ways during the pre-BO phase, which partly decides the fate of a successful BO
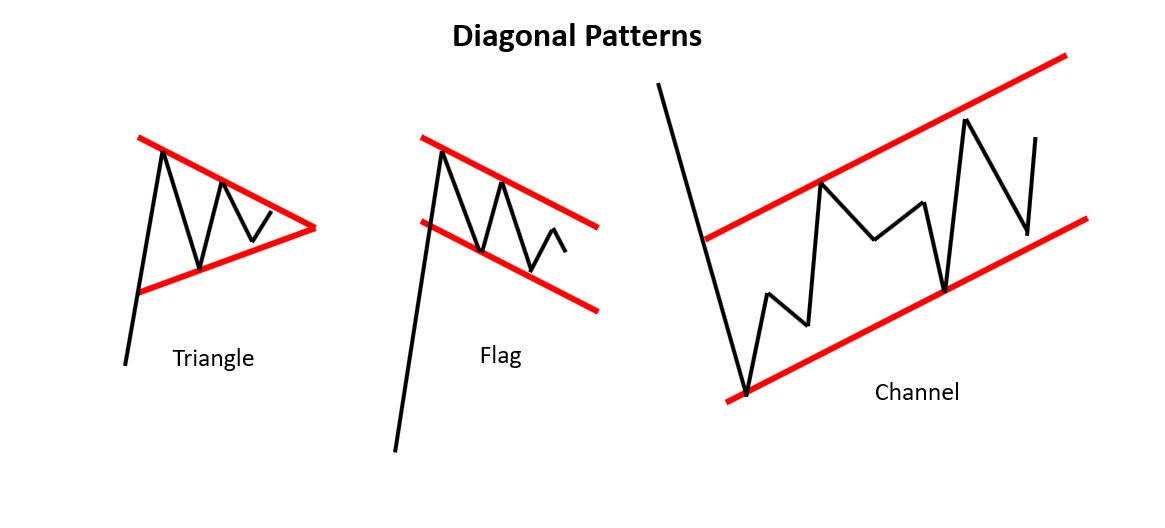
1a/ On the basis of pre-BO price patterns, BOs can be broadly classified into two types. I like to call them diagonal and horizontal/flat BOs.
The BOs from a symmetrical triangle, flag, trend channel are the types of diagonal BOs as the price breaks out the lines inclined to an angle
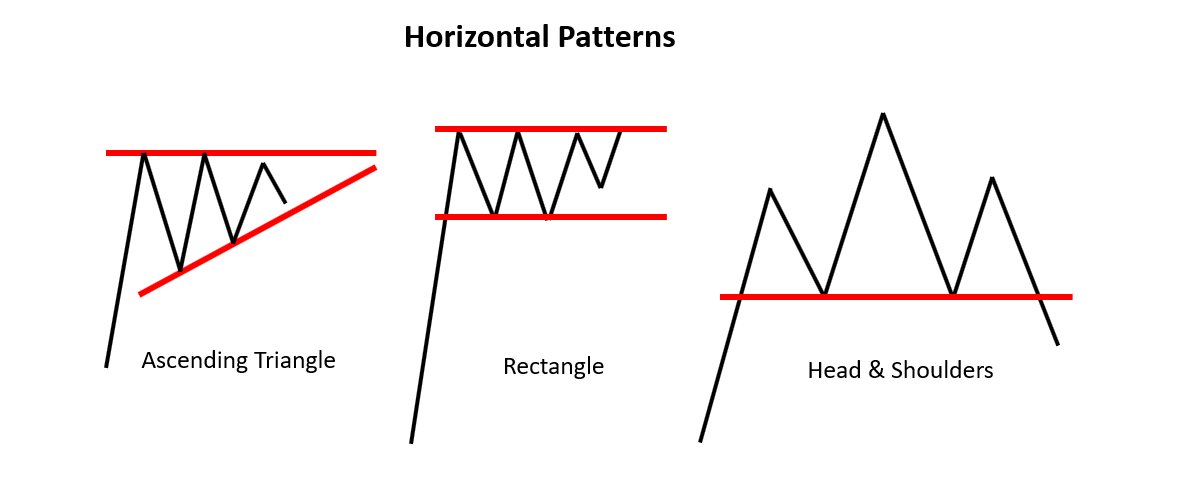
1b/ The BOs from rectangles, ascending/descending triangles, necklines of head & shoulders or its reverse or cup & handle patterns are the examples of horizontal BOs as in all these cases the price breaks out of a horizontal line
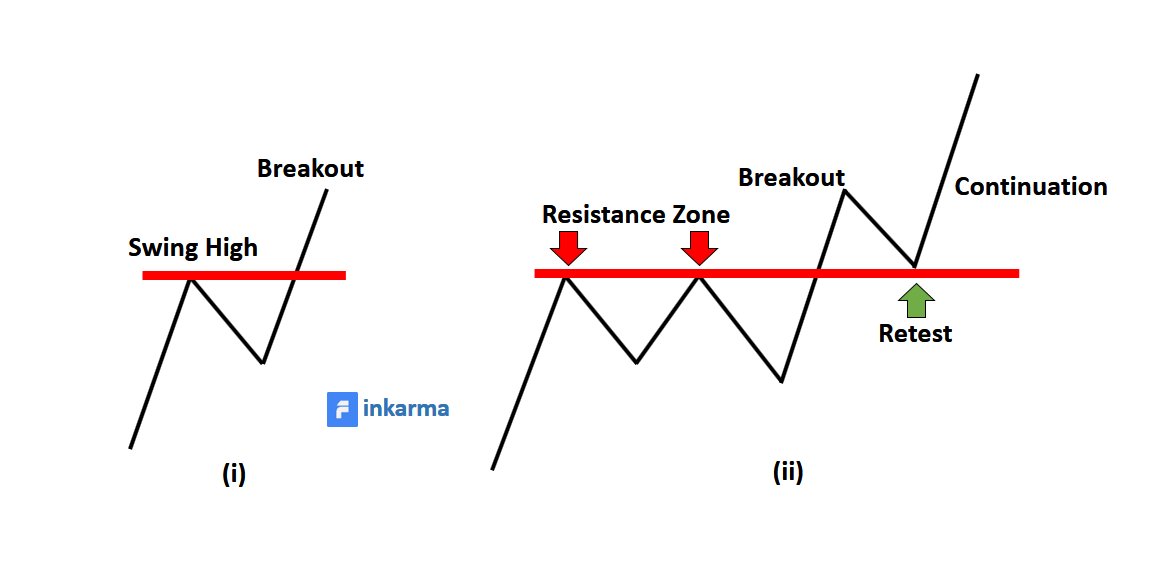
1c/ In its simpler form when price clears a previous swing high or low it is called a BO (see fig i).
But in this thread, we will be dealing with those horizontal breaks where the price faces resistance/support multiple times before it actually breaks out of a level (see fig ii)
But in this thread, we will be dealing with those horizontal breaks where the price faces resistance/support multiple times before it actually breaks out of a level (see fig ii)
2/ Follow-up Price Action
In the following illustration the price faced resistance at a specific level (red line) multiple times.
The price may take multiple attempts before it finally breaks through such resistance.
In the following illustration the price faced resistance at a specific level (red line) multiple times.
The price may take multiple attempts before it finally breaks through such resistance.
There could be several reasons for such a resistance to develop but let’s not get into those as of now
2a/ Pre-breakout observations
Type of reaction from resistance – If reactions are sharp and significant, then there are chances that BO attempt might fail.
On the other hand, if reactions from the resistance are weak then there are more chances for a successful break
Type of reaction from resistance – If reactions are sharp and significant, then there are chances that BO attempt might fail.
On the other hand, if reactions from the resistance are weak then there are more chances for a successful break
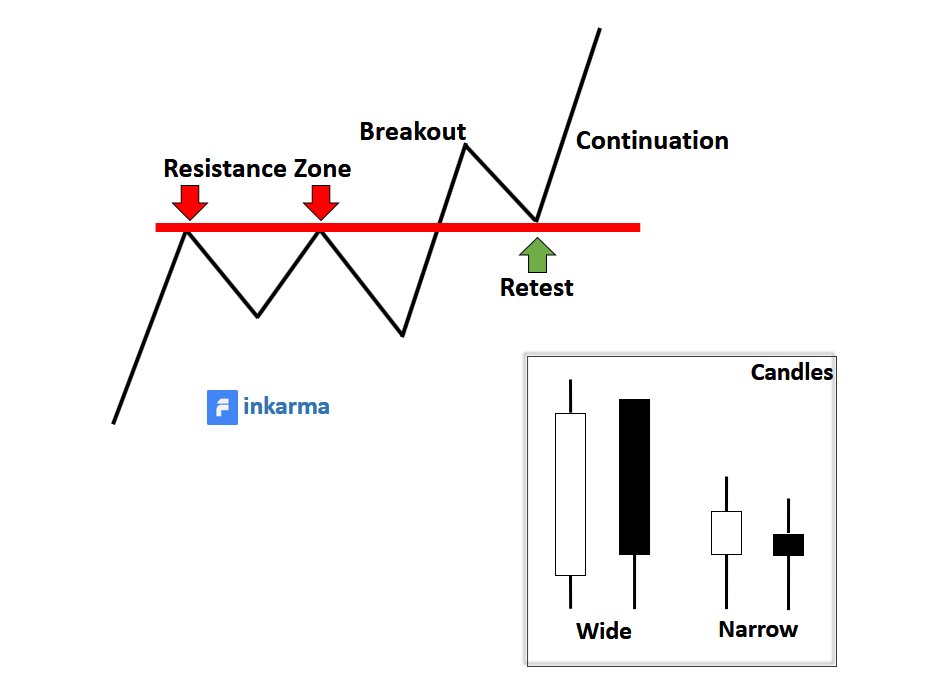
2b/Post-breakout observation
Length of candles – It is favorable to have wider candles at BO. Wider candles suggest greater buying interest and hence chances of a successful BO
Length of candles – It is favorable to have wider candles at BO. Wider candles suggest greater buying interest and hence chances of a successful BO
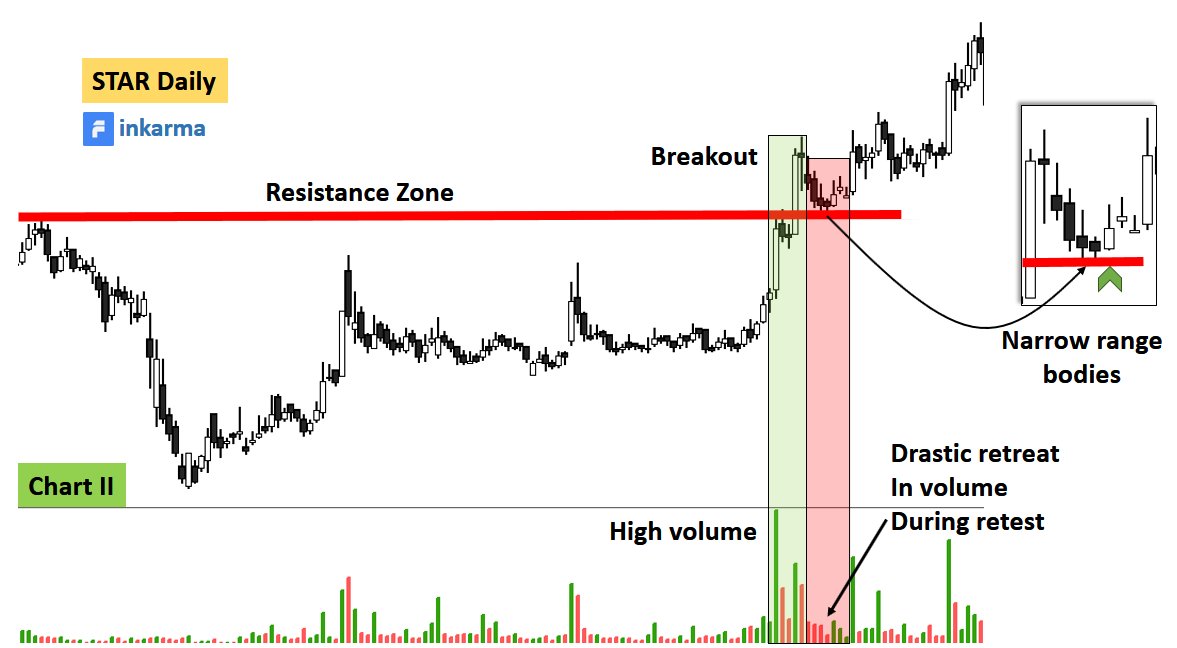
Pullback to BO level – the price may retract back for a retest (see fig above).
If buyers are still interested the stock would rebound after retest and resume in the direction of BO. Narrow candles during the pullback signify more strength
If buyers are still interested the stock would rebound after retest and resume in the direction of BO. Narrow candles during the pullback signify more strength
3/ Reading Volume
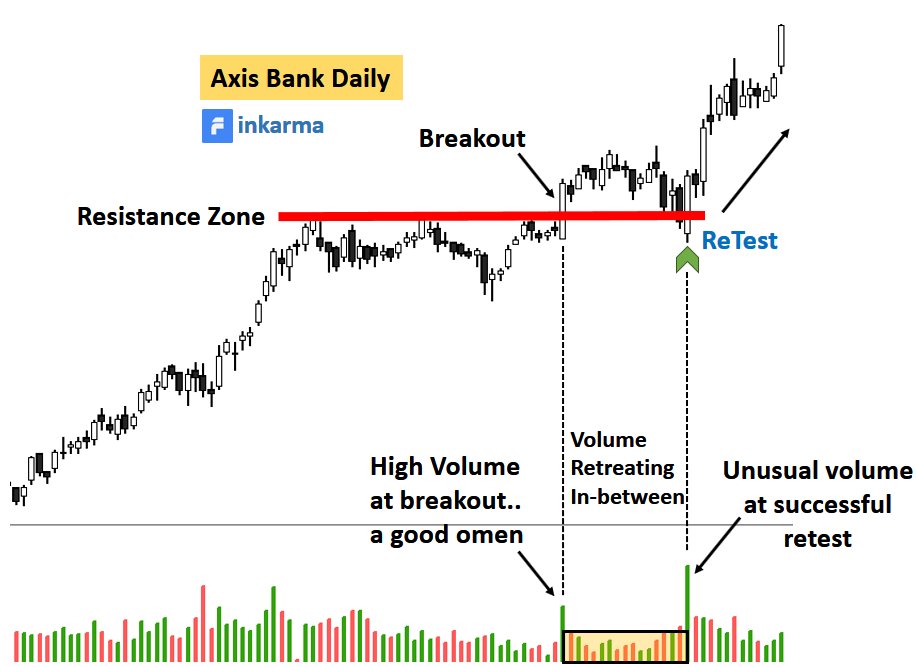
It is ideal to have relatively higher volume at the BO (see volume at A). Ex If the volume at BO is higher than the average volume of say 50 candles, then it is considered as good but there is no rule of thumb or absolute number for high volume
It is ideal to have relatively higher volume at the BO (see volume at A). Ex If the volume at BO is higher than the average volume of say 50 candles, then it is considered as good but there is no rule of thumb or absolute number for high volume
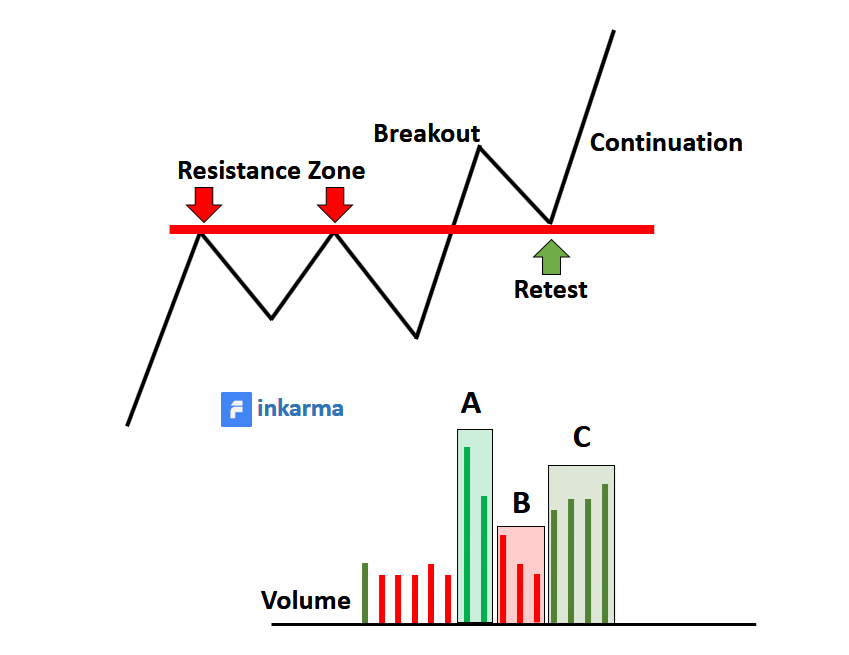
During pullback/retest, volume should contract (see volume at B). Low volume plus narrow candles during pullback suggest weak selling and hence high probability of continuation
After a successful retest there should be continuation with increasing volume (see volume at C). This signifies that buyers are still interested at the higher prices
4/ Types of Breakouts
In the horizontal/flat type discussed above, the post-BO price action is of great importance. This price action decides the success or failure of a BO.
I have classified BOs, on the basis of post-BO price action, into three types as follows
In the horizontal/flat type discussed above, the post-BO price action is of great importance. This price action decides the success or failure of a BO.
I have classified BOs, on the basis of post-BO price action, into three types as follows
4a/ Flying-Foot Breakout
The ‘foot’ represents the place of the BO and ‘flying’ represents the character of the BO.
This type of BO is seen as the market breaks out of a bottom/accumulation phase. I am illustrating only BOs but the same is true for breakdowns.
The ‘foot’ represents the place of the BO and ‘flying’ represents the character of the BO.
This type of BO is seen as the market breaks out of a bottom/accumulation phase. I am illustrating only BOs but the same is true for breakdowns.
A very common observation near a bottom would be a shakeout; a sharp initial rally; and then retracement towards the lows of shakeout.
Market may make multiple attempts to clear the high of the sharp initial rally. This would result into a range
Market may make multiple attempts to clear the high of the sharp initial rally. This would result into a range
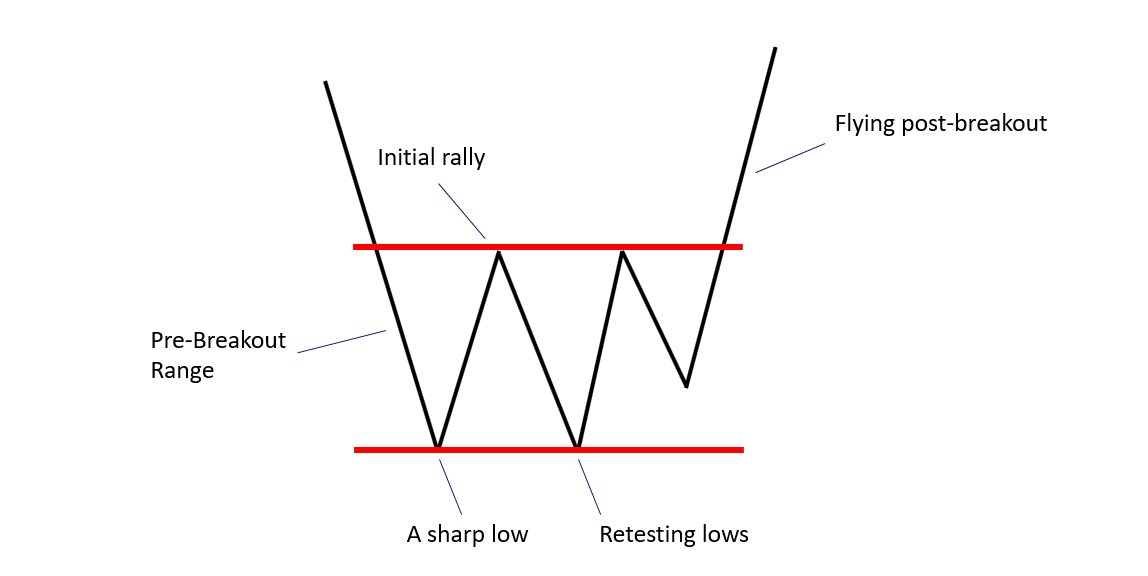
In this type, after a strong footing (accumulation), the price flies sharply to the moon and never looks back.
This entices the fear of missing out and many traders/investors, who could not enter, will have to get in at higher prices only
This entices the fear of missing out and many traders/investors, who could not enter, will have to get in at higher prices only
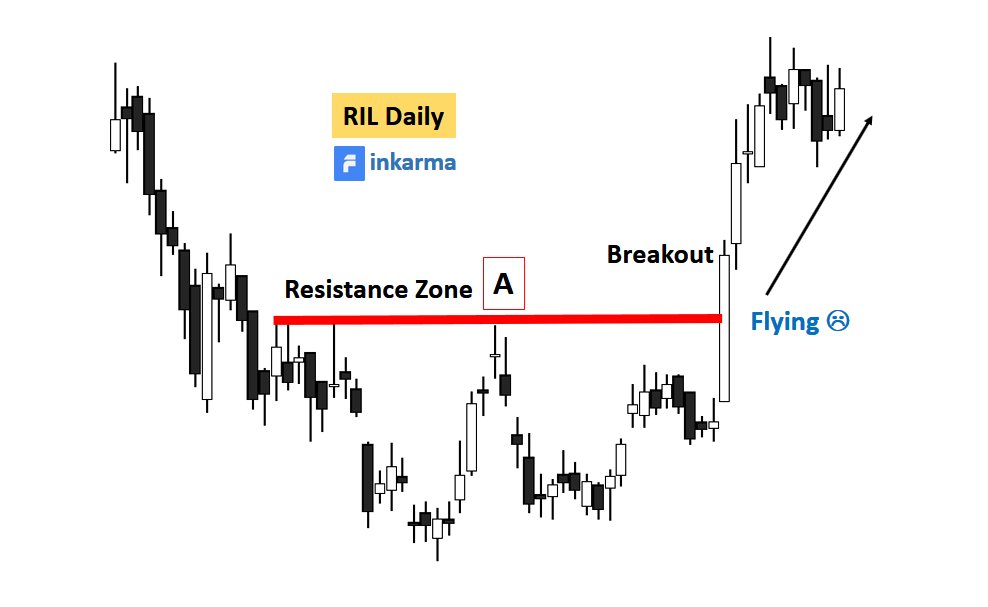
In the following example of RIL there is a strong bear phase ending with a strong initial rally ‘A’. Draw a horizontal red line through A. The price then retraced towards the bottom again but could not break it.
Finally, it broke out of resistance zone ‘A’ and never looked back
Finally, it broke out of resistance zone ‘A’ and never looked back
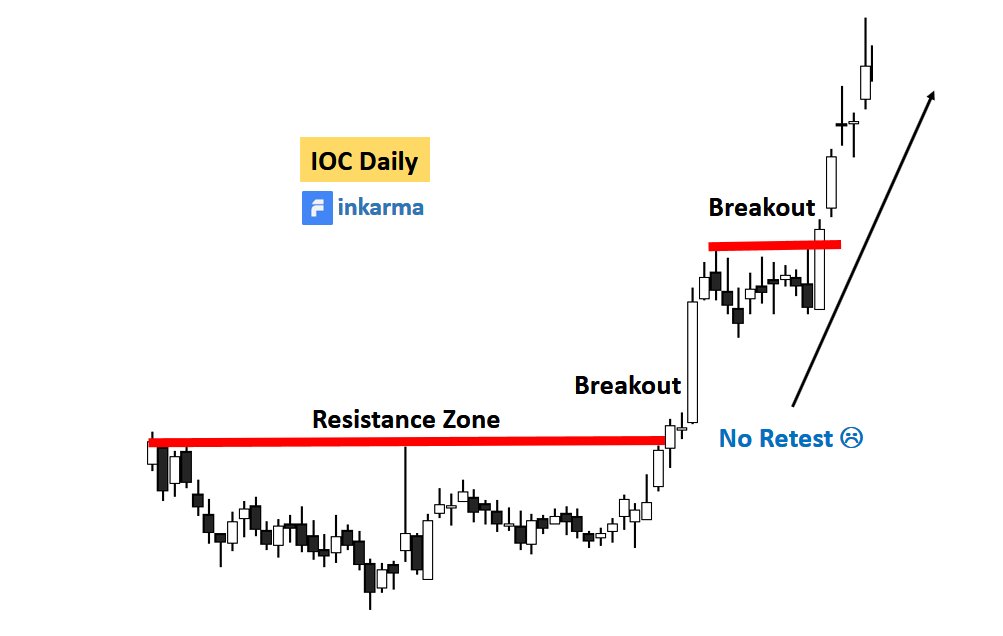
The following example of IOC has a flying-foot BO near the bottom as well as in the middle of the trend.
A small consolidation on a daily chart could have a flying-foot structure on a 15 or 30min chart.
A small consolidation on a daily chart could have a flying-foot structure on a 15 or 30min chart.
Many times dropping down the timeframe provides excellent opportunities to pin-point our entries
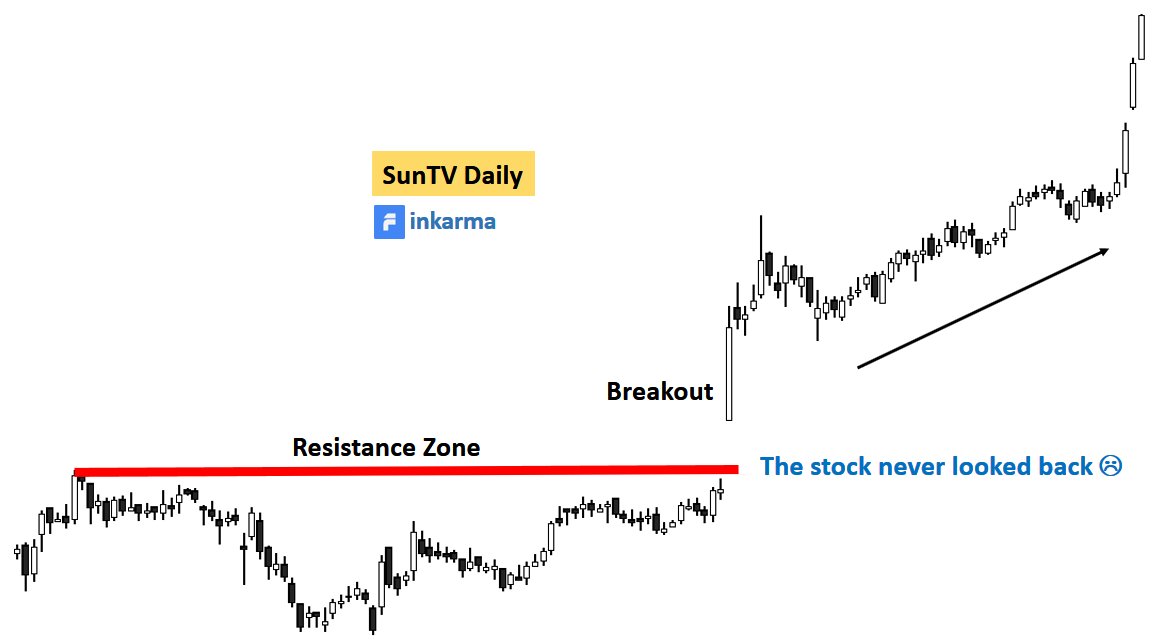
In the following chart of SunTV, price left the resistance zone near bottom with a gap up.
This would have left many traders on the side lines who had no better opportunity than to buy at higher prices.
Three long bullish white candles on the right signal strong buying by left out traders
Three long bullish white candles on the right signal strong buying by left out traders
This would have left many traders on the side lines who had no better opportunity than to buy at higher prices.
Three long bullish white candles on the right signal strong buying by left out traders
Three long bullish white candles on the right signal strong buying by left out traders
4b/ Retest Breakouts (Ideal BO)
Price often pulls back to the BO level to check if the BO was for real and if buyers are still interested.
A sharp BO with wide candles and higher volumes followed by retest with narrow candles and low volume are ideal conditions for this type
Price often pulls back to the BO level to check if the BO was for real and if buyers are still interested.
A sharp BO with wide candles and higher volumes followed by retest with narrow candles and low volume are ideal conditions for this type
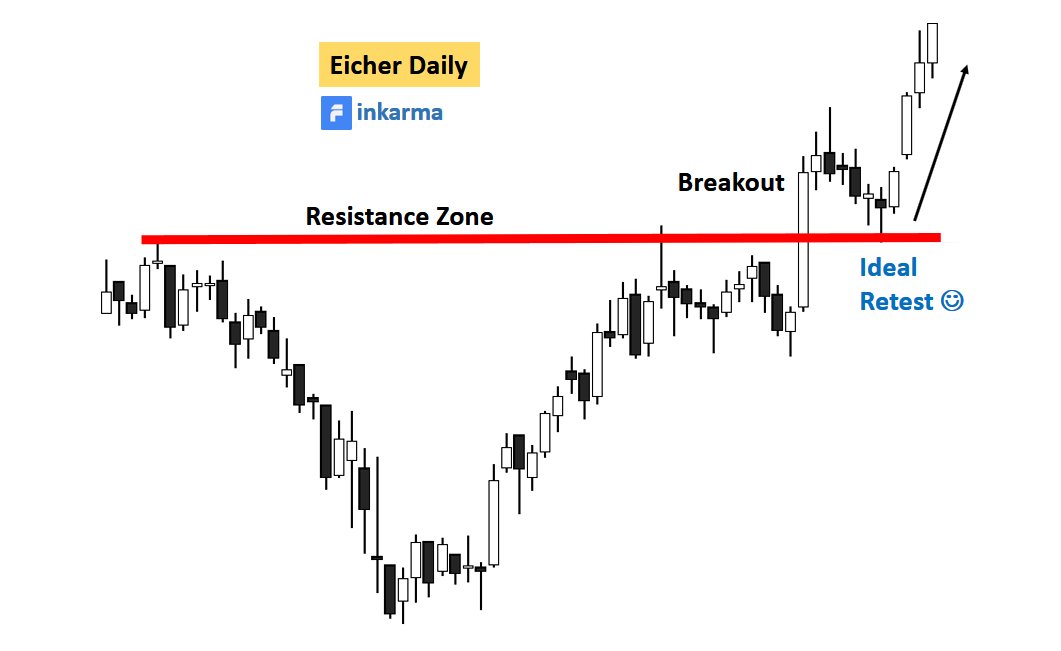
In the following chart of Eicher motors, price broke sharply out of a resistance zone and then pulled back to the cleared resistance area.
Notice narrow candles at the end of the retest suggesting that sellers are not much interested. The stock bounced sharply from the test zone
Notice narrow candles at the end of the retest suggesting that sellers are not much interested. The stock bounced sharply from the test zone
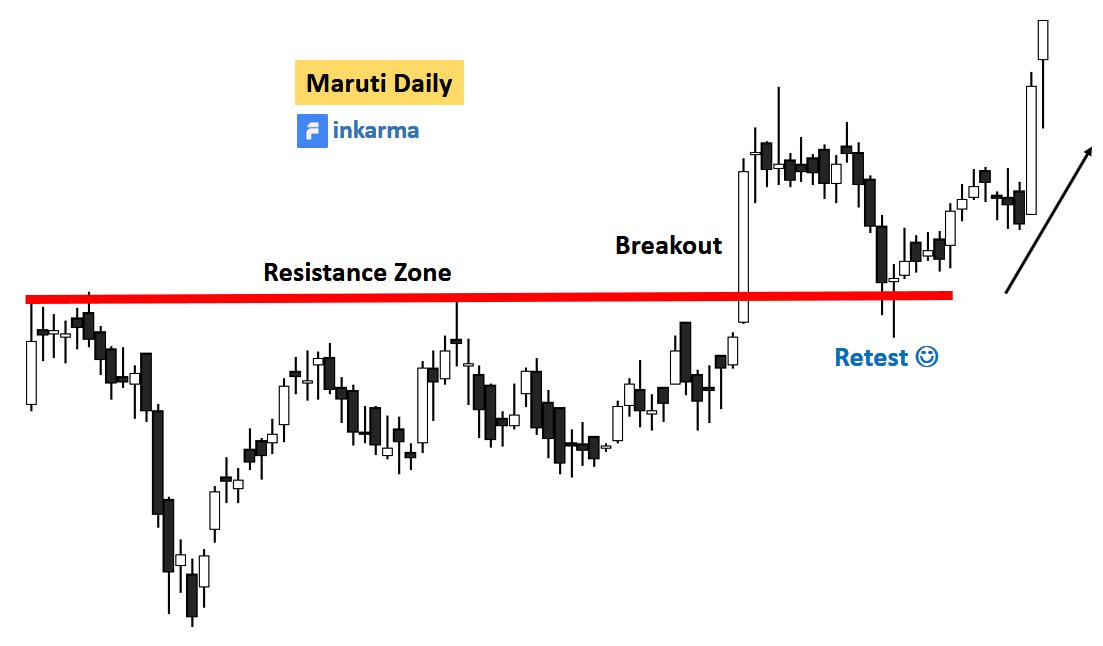
Maruti had a similar BO as the pullback ended with a narrow body pin-bar at the test zone resulting in a sharp bounce back.
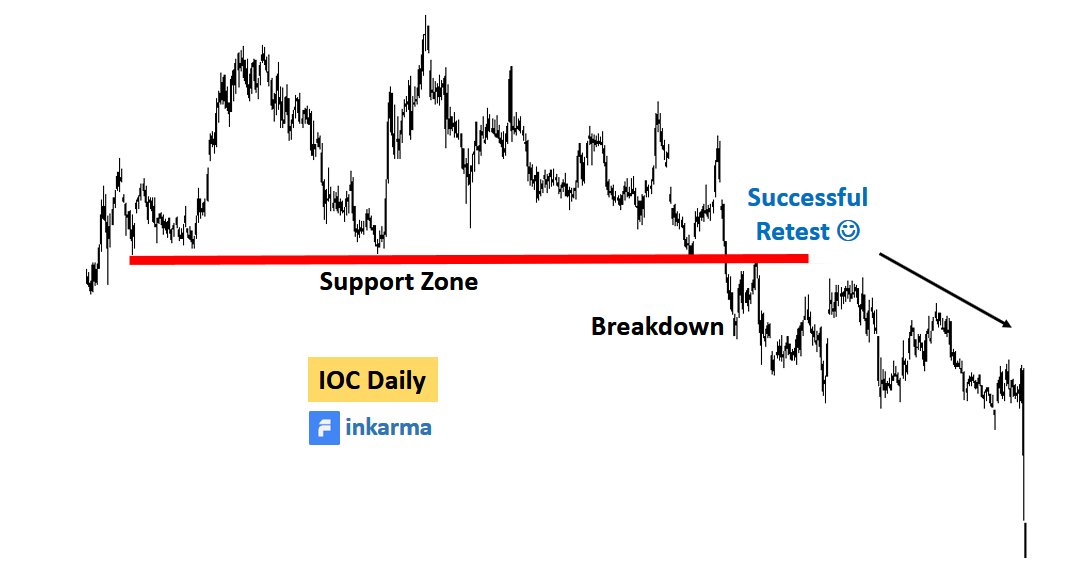
In the following breakdown example of IOC, the price first broke sharply below a longer-term support zone and then retested the zone once again.
As there was more selling interest, the price resumed in the direction of the breakdown.
As there was more selling interest, the price resumed in the direction of the breakdown.
4c/ Multi-Retest Breakouts
This type is similar to the retest BO type with one difference that the price tests the BO/breakdown level multiple times rather than just one time
This type is similar to the retest BO type with one difference that the price tests the BO/breakdown level multiple times rather than just one time
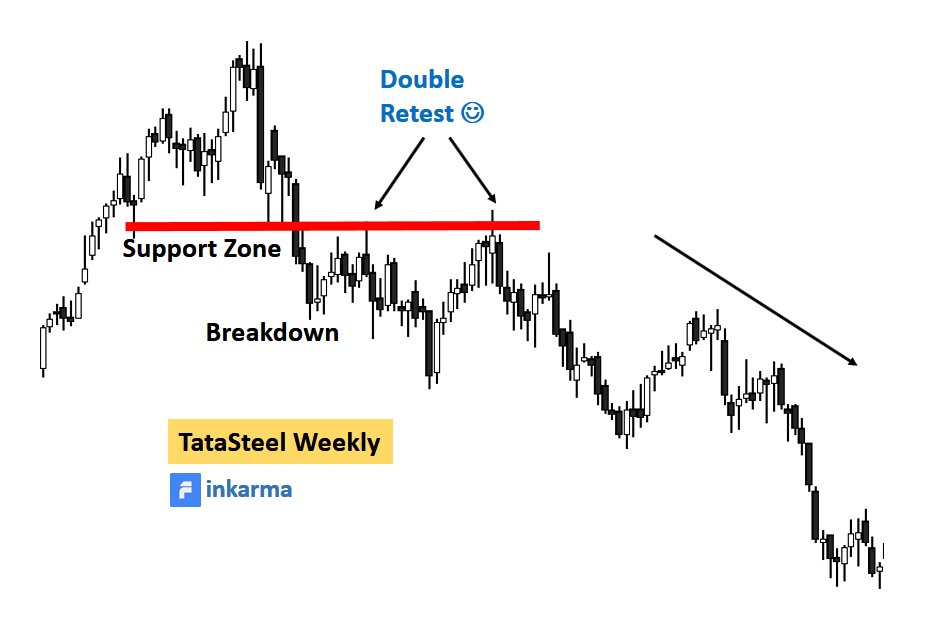
In this Tata Steel chart there was a sharp reaction from the top which halted near a prior support zone.
We can draw a line (red) through this zone. This support was broken and the two very clear retests of the breakdown level eventually resulted into downtrend
We can draw a line (red) through this zone. This support was broken and the two very clear retests of the breakdown level eventually resulted into downtrend
The level was retested followed by some buying, resulting in a small rally.
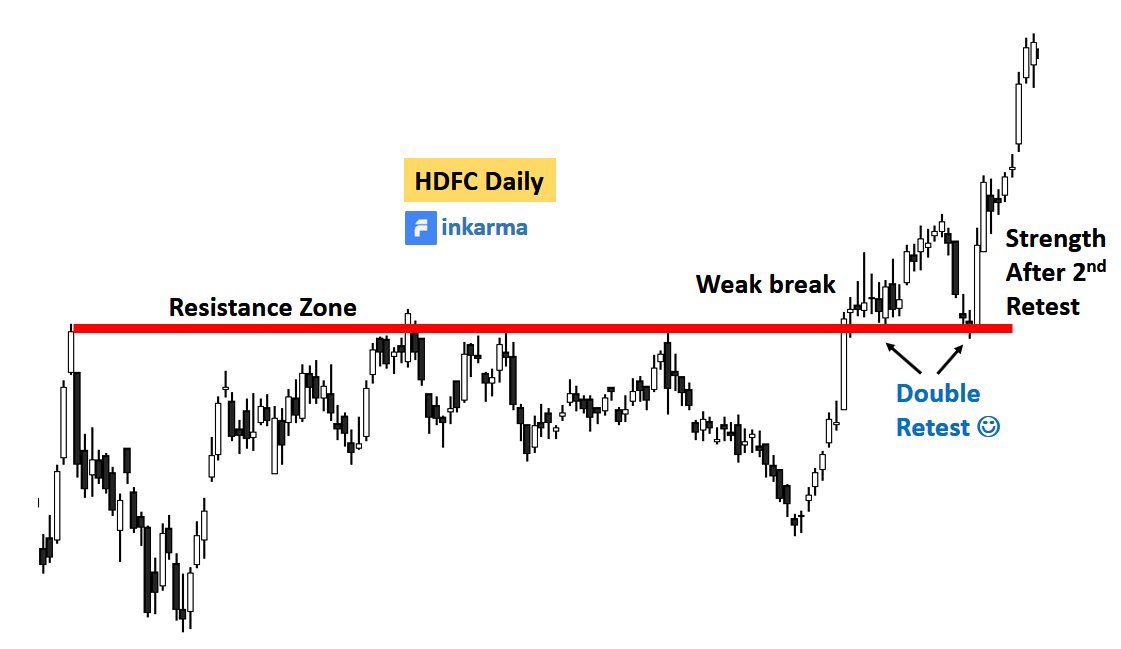
The stock did a second retest which was sharper but ended in a two narrow Dojis at the BO level.
The stock gained strength after this second attempt and shot-off in the direction of break
The stock did a second retest which was sharper but ended in a two narrow Dojis at the BO level.
The stock gained strength after this second attempt and shot-off in the direction of break
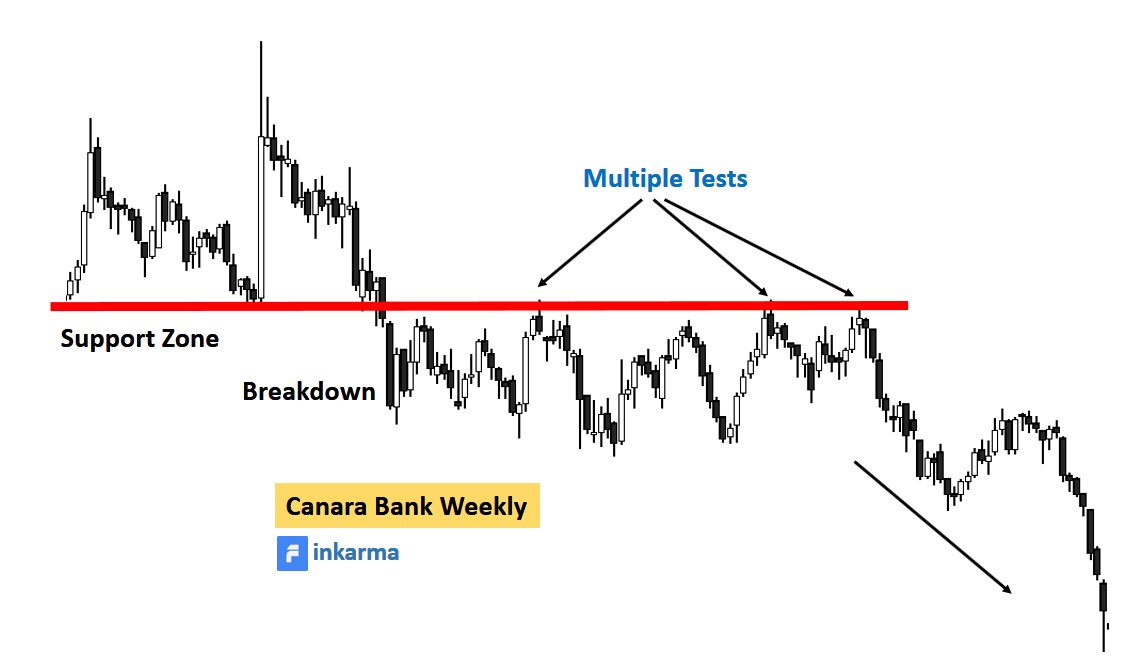
Canara bank weekly chart is also a very good example of multiple tests.
A sharp breakdown of support but price then built a kind of range below the support zone with three clear tests of breakdown level. This led to a change in the trend
A sharp breakdown of support but price then built a kind of range below the support zone with three clear tests of breakdown level. This led to a change in the trend
5/ Trading Breakouts
There are two ways to trade a breakout/breakdown
Aggressive Trade
Pullback Trade
There are two ways to trade a breakout/breakdown
Aggressive Trade
Pullback Trade
5a/ The most aggressive trade would be to buy a BO as it occurs, that is intraday. Means buying as soon as the price breaks few ticks above the resistance.
But as most intraday BOs fail, this type is not recommended for novice traders
But as most intraday BOs fail, this type is not recommended for novice traders
Waiting till the end of BO day is a less aggressive approach.
Let the candle close strongly above the resistance level, then buy just few minutes before the market close with stop below the BO candle or the most recent swing low
Let the candle close strongly above the resistance level, then buy just few minutes before the market close with stop below the BO candle or the most recent swing low
5b/ This second type of trade is the least aggressive.
The trader, post-BO, waits patiently for a retest. Entry would be right above a pin bar/narrow bar/bullish candle at the retest level with stop below the most recent swing low
The trader, post-BO, waits patiently for a retest. Entry would be right above a pin bar/narrow bar/bullish candle at the retest level with stop below the most recent swing low
Besides price action, the trader should also keep an eye on volume.
Ideally volume should be high on a BO day.
It should be retreating during pullback and increase after retest and continuation
Ideally volume should be high on a BO day.
It should be retreating during pullback and increase after retest and continuation
In the above chart of Axis Bank, retest entry would be on unusual volume retest bullish white candle closing (refer green arrow day)
The following chart is another example of a valid pullback trade. The stock came out of resistance and then pulled back for test (refer chart I below)
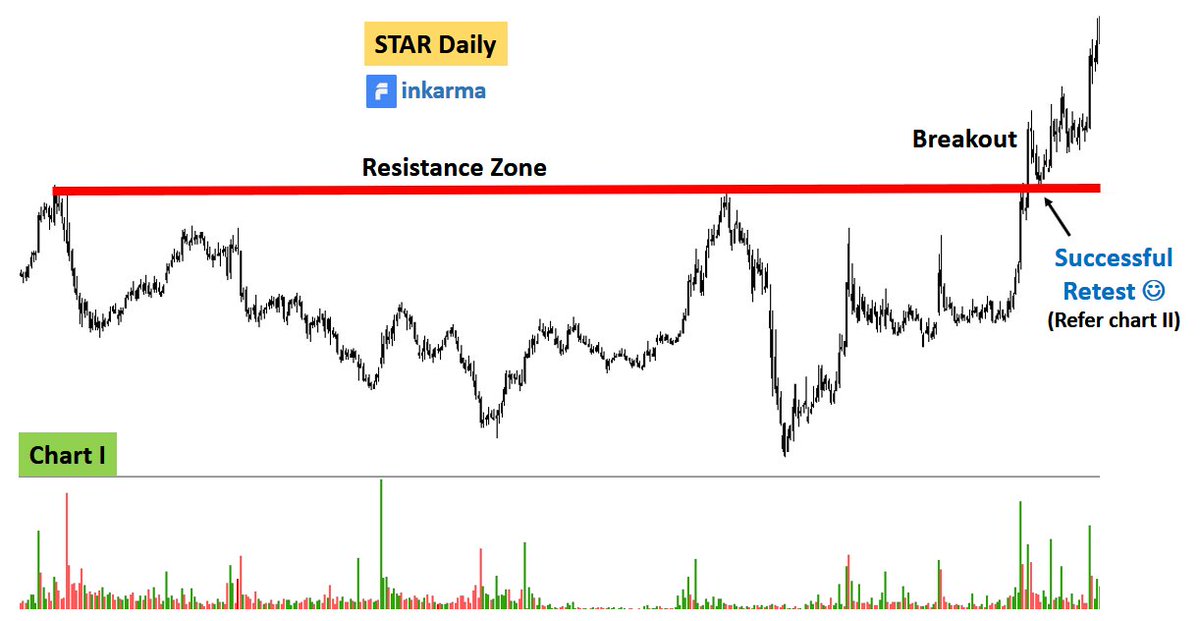
If we zoom in chart i, we see a strong candle close on BO day with high volume (refer chart ii below).
It was followed by a low volume pullback with narrow candles at the retest. There could be an entry on the first bullish/up candle (green arrow day)
It was followed by a low volume pullback with narrow candles at the retest. There could be an entry on the first bullish/up candle (green arrow day)
It’s worth mentioning here that the trader might miss some opportunities with retest entries.
This is because sometimes there are no retests after BOs. But that’s perfectly fine to miss a few trades in order to take high probability trades
This is because sometimes there are no retests after BOs. But that’s perfectly fine to miss a few trades in order to take high probability trades
6/ Breakout Failures
Stock market is not a perfect world. Many BOs would make you money but the others will fail. It is the money management and trade management that protects a trader in case of the latter
Stock market is not a perfect world. Many BOs would make you money but the others will fail. It is the money management and trade management that protects a trader in case of the latter
As a rule of thumb, I would like the BO to be stronger, cleaner with high volume. A strong break means conviction by the traders/investors.
I would never like to see price falling back below the BO level. If that happens, I would surely close the trade
I would never like to see price falling back below the BO level. If that happens, I would surely close the trade
An aggressive buy on the BO day in TCS and the next day was a Doji, means lack of conviction.
The price, instead of going up, came down sharply the day after - first indication that buyers are not interested. One can think of closing partial position at this point
The price, instead of going up, came down sharply the day after - first indication that buyers are not interested. One can think of closing partial position at this point
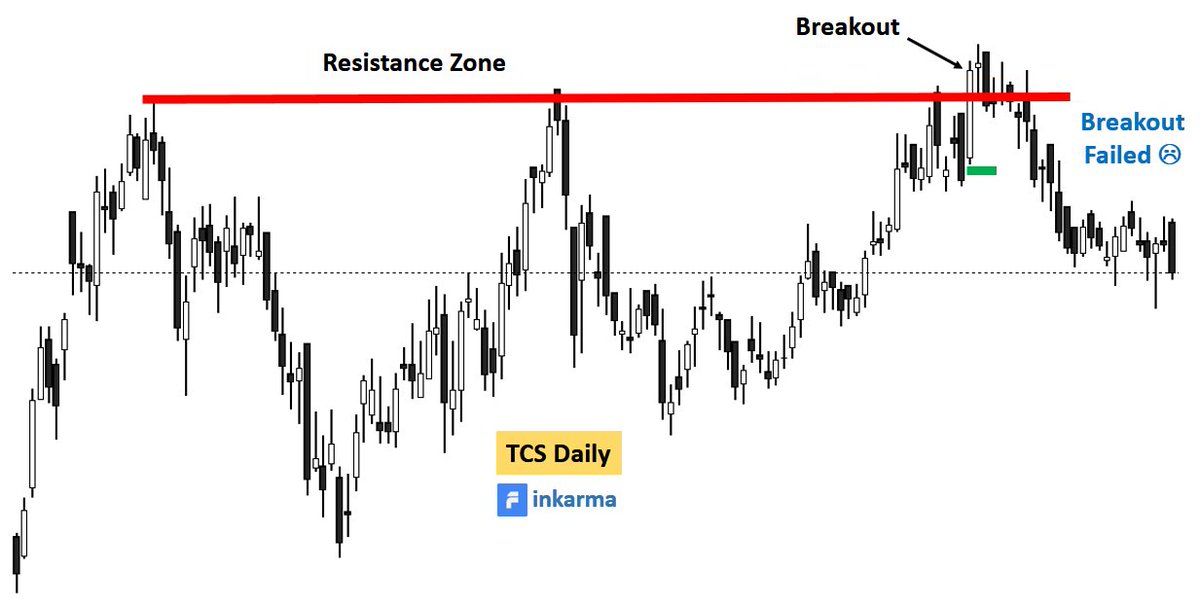
A couple of days later the price fell back below the BO level. A stop loss below the BO candle (refer green line on the chart) would be a good place to close the entire position.
7/ Book Spikes Near Top
There is a difference between buying a BO near a bottom and buying a BO at the top of a mature trend. I would surely love to keep the former for longer-term and the latter for short term
There is a difference between buying a BO near a bottom and buying a BO at the top of a mature trend. I would surely love to keep the former for longer-term and the latter for short term
Sometimes BOs near a top will give you quick 10-20% in just a couple of days before everything fades out. That spike in price would be a right time to book profit.
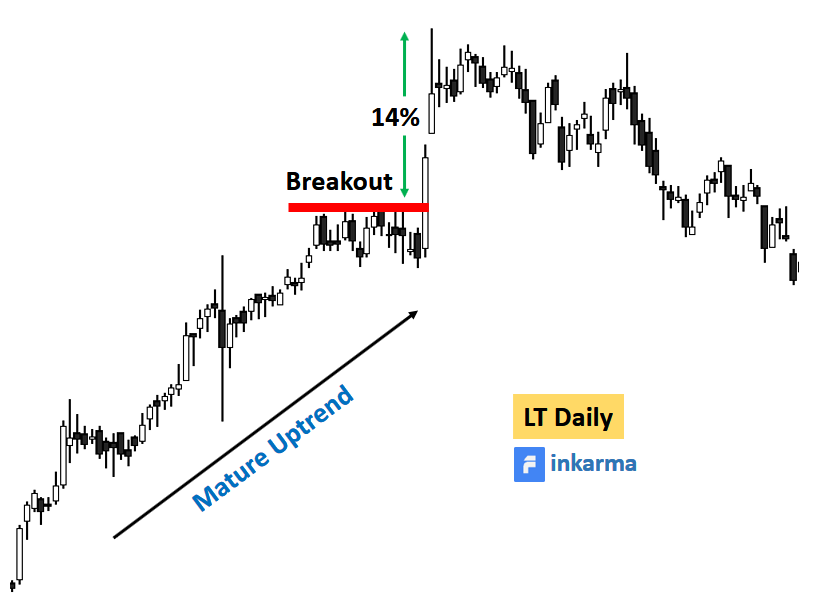
In the above LT chart, the stock had a mature uptrend in the background and then a BO which resulted in a 14% spike in just two days.
I would avoid trading such a BO on pullback/retest as such spikes sometimes lead to change in trend.
I would avoid trading such a BO on pullback/retest as such spikes sometimes lead to change in trend.
8/ Key Takeaways
8a/ BOs are highly sensitive patterns obtained as a result of supply-demand imbalance.
Various other factors such as, fear, greed, and stock valuations also work silently behind a BO
8a/ BOs are highly sensitive patterns obtained as a result of supply-demand imbalance.
Various other factors such as, fear, greed, and stock valuations also work silently behind a BO
8b/ The trader needs to understand the location of a BO as well as the risk involved.
Breaks near the bottom would sustain for a longer period of time and generate healthier returns than breaks near a top which may end up as spikes
Breaks near the bottom would sustain for a longer period of time and generate healthier returns than breaks near a top which may end up as spikes
8d/ Some key points such as length and character of the candles, intensity of waves and volume behavior decide the fate of a BO
8e/ The trader should develop his own/unique BO system like: wide candles at BO with high volume; narrow candles at retest with retreating volume; and bullish candle(s) at retest as prerequisites for taking a trade
8f/ If one of these characteristics is missing, then he should skip the trade.
Of course some other system can also be designed for aggressive entries.
Whatever BO system a trader adopts, he should work on it for the next bunch of trades before reaching any conclusion
Of course some other system can also be designed for aggressive entries.
Whatever BO system a trader adopts, he should work on it for the next bunch of trades before reaching any conclusion
I hope you learnt something useful from this write-up. If it was helpful, then please like and retweets
Stay tuned @finkarmaIN for more such writeups in the coming days
Thanks for reading
Stay tuned @finkarmaIN for more such writeups in the coming days
Thanks for reading
• • •
Missing some Tweet in this thread? You can try to
force a refresh


