Recently on Talk Sport Simon Jordan @Sjopinion10 claimed, “Klopp’s net spend is £28m-a-year, Pep’s is £100m-a-year.” This thread will look at #LFC and #MCFC accounts to see whether this statement is correct – and whether we should assess their expenditure in a different way.
Klopp arrived at #LFC in October 2015, i.e. after the 2015 summer transfer window, so the 2016/17 season is his effective starting point. Guardiola started at #MCFC in 2016/17, so it’s the same for him. This analysis will therefore look at the 5 years up to the 2020/21 accounts.
In that period, #MCFC have reported £656m net spend, averaging £131m a year, which is over twice as much as #LFC £318m (£64m average). In fact, Liverpool have also been outspent in this period by #MUFC £630m, #CFC £465m, #AFC £428m and #EFC £359m. 
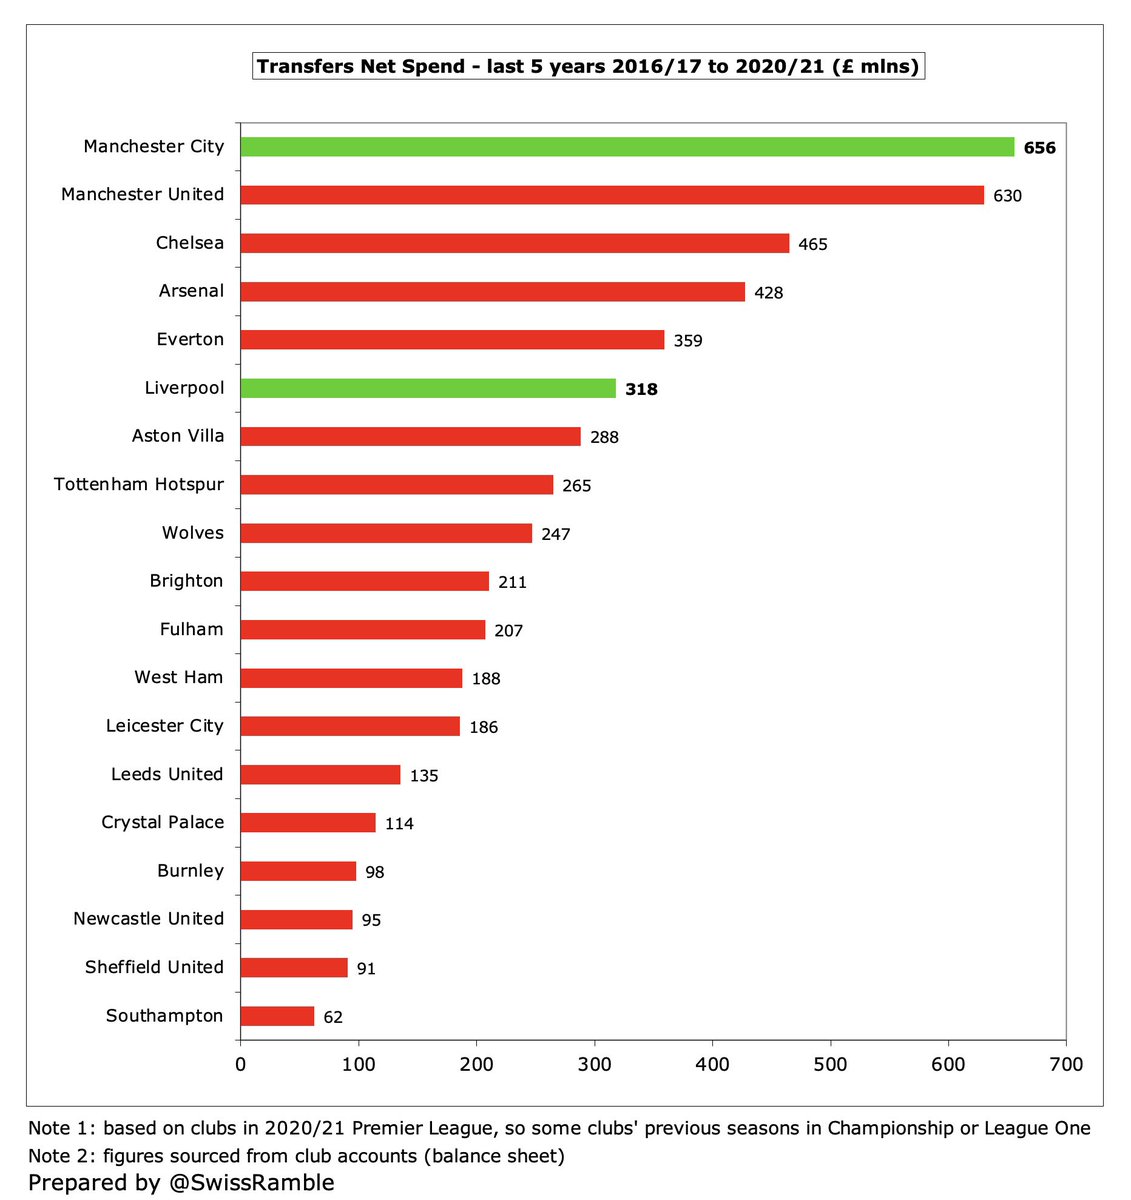

In terms of gross spend, #MCFC have spent just under a billion in the last 5 years, the same as #CFC, while #LFC outlay is only around two-thirds as much at £660m. Even on a gross basis, the Reds are below under-performing #MUFC £850m and #AFC £676m.


Interestingly, #MCFC and #LFC had very similar sales during the last 5 years with £342m and £336m respectively, though they were far below #CFC £526m, as player trading has been a key element of the Blues’ business model. Next highest were #LCFC £298m and #EFC £288m.


Football clubs have not yet published accounts for the 2021/22 season, but if we add net spend from Transfermarkt, we can see the picture to date for Guardiola and Klopp (excluding this summer’s transfers), with #MCFC £693m over £300m more than #LFC £372m, both below #MUFC £729m.


So Simon’s estimate of £100m annual net spend was fairly close for Pep (£115m), but significantly understated Klopp at £28m (actually £62m). Interestingly, most of the difference was established in 2016-18 (£201m vs £31m), while #LFC have outspent #MCFC since then (£77m vs £73m).

As a technical aside, these figures are from the balance sheet in the club accounts. The calculation for player sales is book value plus profit on player sales (value equals cost less amortisation for disposals). Note: player purchases here include agent fees and signing-on fees.


Worth noting these numbers are different from other transfer figures, e.g. purchases & sales in the cash flow statement or those widely reported on the Transfermarkt website, eg LFC net spend in 2020/21 is £93m on balance sheet, £56m in cash flow and only £26m in Transfermarkt.


So far, so good, but is net spend really the best indicator of a manager’s firepower? Surely wages must also be a factor. For example, if a club gets a great player on a free transfer, but has to pay him top dollar, that would not be captured by the net spend metric.
In terms of wages, #LFC are much closer to #MCFC with their £1.4 bln in the 5 years up to 2020/21 being just 9% lower than City’s £1.5 bln. The only other Premier League clubs over a billion in this period are #MUFC £1.5 bln, #CFC £1.4bln and #AFC £1.1 bln.


What we really need to do is to look at the overall cost of a squad by combining transfer fees and wages. One way of doing this is to add together wages and player amortisation, which is the way that football clubs account for transfer fees.
Basically, football clubs consider players to be assets, so they do not fully expense transfer fees in the year a player is purchased, but instead write-off the cost evenly over the length of the player’s contract via player amortisation.
So if a player is purchased for £25m on a 5-year contract, the annual amortisation in the accounts would be £5m, i.e. £25m divided by 5 years. This means that the player’s book value reduces by £5m a year, so after three years his value in the accounts would be £10m.

#MCFC £674m player amortisation over the last 5 years is nearly 50% more than #LFC £461m. In fact, Liverpool’s player amortisation is only fifth highest in the Premier League in this period, as they are also below #CFC £669m, #MUFC £631m and #AFC £479m.


This approach is not perfect, as clubs can reduce amortisation by signing players on longer contracts. For example, #LFC have just signed Darwin Nunez from Benfica on a 6-year contract, rather than the usual 5 years (or lower). Nothing dodgy, but it does reduce the annual charge.
Clubs can also book an impairment charge if they assess a player’s value as less than the amount in the accounts. In such cases, the reduced value is written-off over the remaining years of the contract, but the annual amortisation will be lower going forward.

Some Premier League clubs have booked a fair amount of impairment, which usually implies poor recruitment, though this has also been impacted by COVID depressing the transfer market. However, this is not a big factor for either #MCFC (£19m) or #LFC (£1m).


If we look at wages and player amortisation combined, #MCFC are still top of the Premier League tree over the last 5 years with £2.2 bln, though not too far ahead of #MUFC £2.1 bln. They are 18% ahead of #LFC £1.9 bln, but the gap is nowhere near as much as implied by net spend.


If we restrict this analysis to the last season reported (2020/21 for published accounts), it’s a very similar story with #MCFC £500m (wages £355m & player amortisation £146m) being 19% more than #LFC £422m (wages £314m & player amortisation £108m).


Just for a bit of fun, let’s now look at this summer’s major deals: Erling Haaland to #MCFC and Darwin Nunez to #LFC. I should emphasise that most of these figures are taken from media reports, so they will not be completely accurate, but they will help illustrate some points.
Thanks to his release clause, Haaland’s transfer fee was relatively low at £52m, though there are also £44m additional fees (agent, father’s commission), giving £96m total cost. Based on weekly £375k salary, the cost over 5-year contract is £98m, giving £193m total commitment.

Nunez’s transfer fee is £65m plus £22m add-ons (reportedly easily achievable). If we assume the agent’s fee is 20% (£13m), the total cost would be a cool £100m. A weekly £140k salary over the 6-year contract means a total cost of £44m, giving £144m total commitment.

This highlights that there are many things to be considered when looking at the cost of a transfer. For example, Haaland’s transfer fee is much lower than Nunez’s (especially after add-ons), but the total commitment is far higher once we include agent fees and salary.

In conclusion, Simon Jordan is correct that Klopp’s net spend is lower than Pep’s (though not by as much as he said), but a more meaningful comparison would also consider wages. On that basis, Pep has still spent more, but the difference is far smaller.
• • •
Missing some Tweet in this thread? You can try to
force a refresh