How is the time-based power-law for #btc price affected by new data? On the left, the model fit on the data available at the time I published the model (hcburger.com/blog/powerlaw). On the right, the model fit on all data up to today. Barely any change! Good!
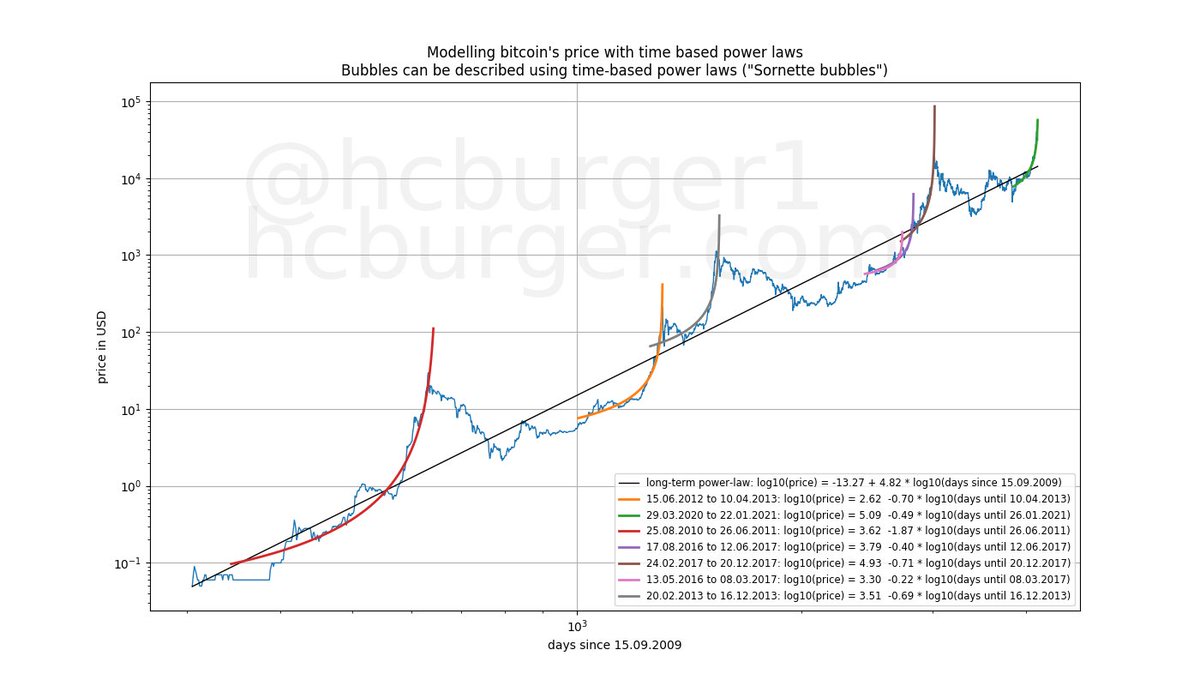
The fact that the two fits are virtually identical means that the price action between September 2019 and now was perfectly in line with the 2019 model's expectations. From the model's point of view, nothing very interesting has happened! The new model is even a tad more bullish.
What about the S2F model? The price has so far been below the forecasts made by the model. Hence, we expect that re-fitting the S2F model should yield lower forecasts. And this is indeed the case! The longer the price stays below forecasts, the stronger this effect.
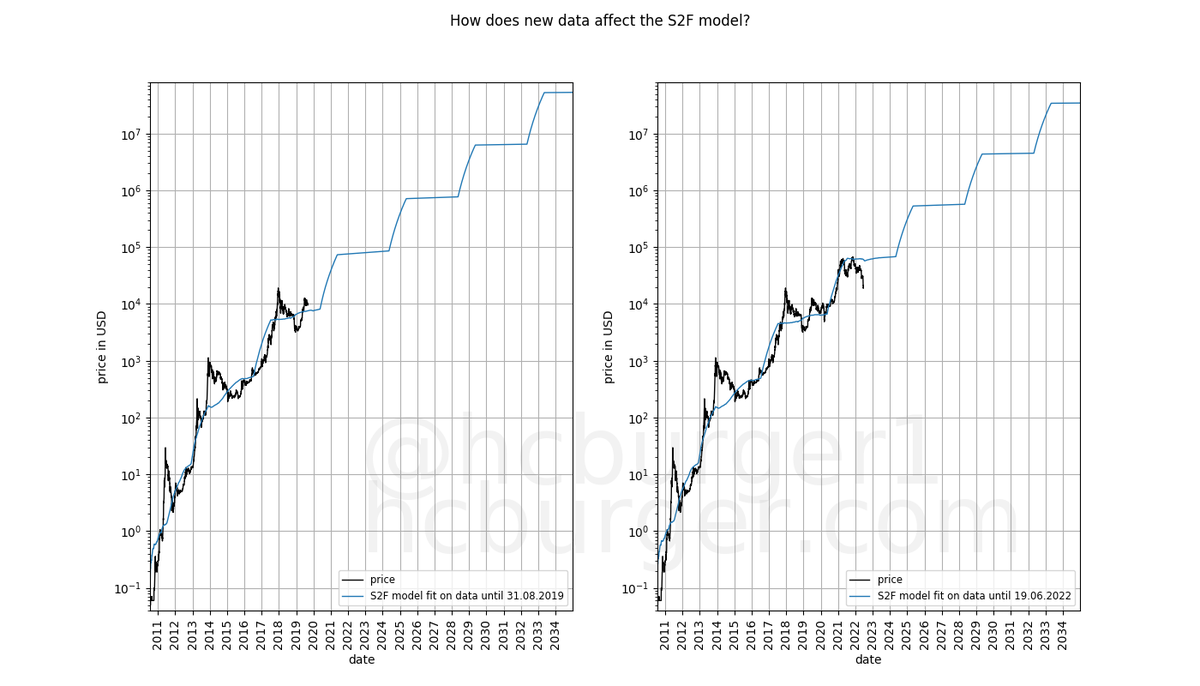
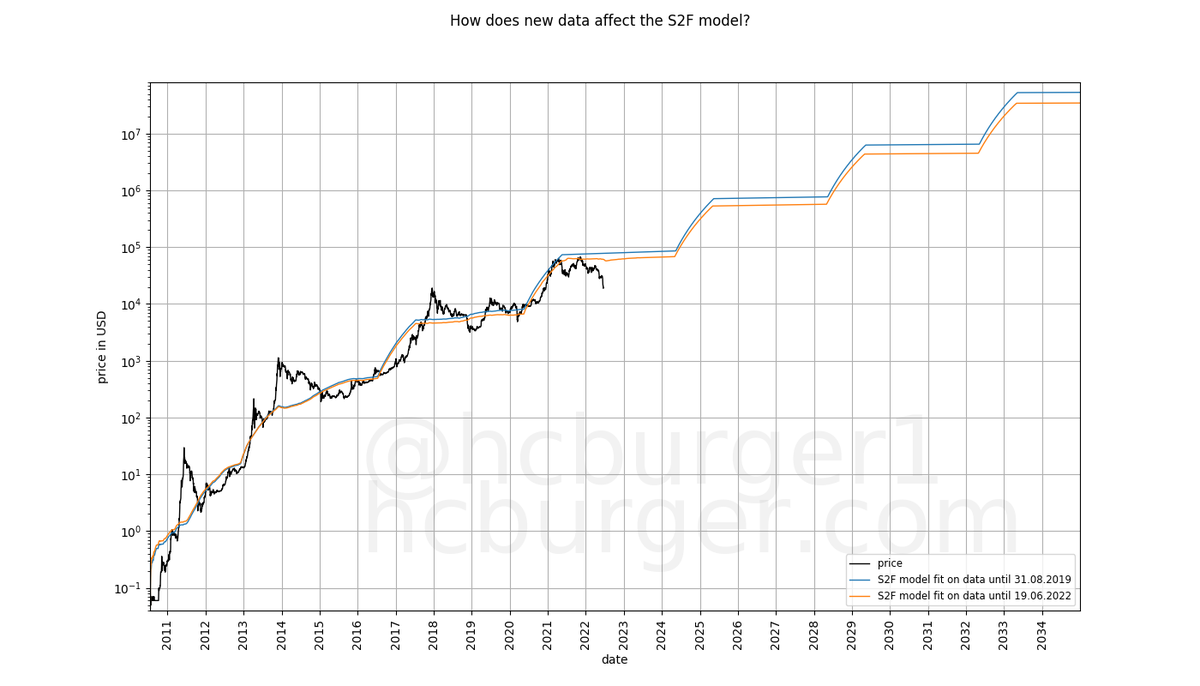
Any model will adjust its forecasts when refit on new data. But it's better if the forecast adjustments are small, and sometimes positive and sometimes negative. It's a bad sign if the adjustments are large and always in the same direction.
The fact that the time-based power-law is so stable over time means that the power-law corridor of 2019 need not be changed in spite of new data being available. The price is behaving according to plan. medium.com/quantodian-pub…
• • •
Missing some Tweet in this thread? You can try to
force a refresh
Excellent point! Yes, due to diminishing returns fixed-length MAs don't make sense.
It's highly likely that #btc will drop below the 200 week moving average at some point.
It seems to be implied that because #btc has never dropped below the 200 WMA (so far), it presents a good support level. Yet that doesn't take into account diminishing returns.
This logic doesn't make sense when taking into account diminishing returns. As the price increases more slowly, there is a higher chance for it to drop below the 200 WMA.
Here is a similar example with the SMA1458d.
What to make of the current price of bitcoin?
In Sep 2019 I predicted that btc would continue to move in the corridor defined by the red and green bands in the future.
You can see in red how the price has fared compared to those predictions since then. 🧵 hcburger.com/blog/powerlaw
A drop in price is of course not fun. But current prices are not something that should concern us from a fundamental perspective. We are in line with expectations (which have been set in the past, empirically).
In the past, the price has spent have the time in the green zone, and half the time in the red zone. This must not necessarily be so in the future, but we have now just re-entered the green zone.
I was curious whether I could model your "log growth curve" corridor mathematically, what I could learn from it, and how it compares to my own model. Insights below👇
Let's first look at the raw data points of @davthewave's corridor, using both a linear and a log time scale. Observations: 1. the corridor tightens with time 2. the price seems to have a terminal value, after which it does not grow anymore.
What is the terminal price? How tight does @davthewave's corridor ultimately become?
Let's model it mathematically. This will allow us to project the corridor into the future.
I have been criticizing the forecasts of S2F model since 2019, but I don't agree with this article. It arrives at some correct conclusions based on wrong arguments.
Let me elaborate.👇 bitcoinmagazine.com/markets/why-bi…
The article claims that the S2F model is a tautology, and therefore totally nonsensical: "In layman’s terms PlanB is essentially asserting that “Stock is a function of Stock.”"
But is S2F really a tautology?
Simply writing down the mathematical expression and re-arranging a bit shows us that this is NOT the case. S2F is NOT a tautology. It does NOT state that stock is a function of stock.
#btcusd: Should we expect another leg up this year?
I think not:
1. If the stock market is like an avg 2nd year presidential year, it will move sideways. #btc is moved by similar mechanisms/confounders and is unlikely to behave very differently.
2. #btc just came out of a bull market.
The logical next thing to happen is a bear market, not another bull market.
However: This bull market was weaker than previous ones, which weakly suggests the bear market might also be weaker. hcburger.com/blog/powerlaw
There seems to be a lot of hope that another leg up might be happening anytime soon, but this seems to be based mostly on wishful thinking (as far as I can tell).
Another move down or prolonged sideways movement is more likely than a strong move up.
1/ #Bitcoin 's price history is full of time based power laws. Inspired by Sornette et al. I looked for bubbles and anti-bubbles that can be described by power laws.
Plenty of them!
Bubbles and anti-bubbles are short-lived. The long-term power-law governs all of bitcoin's history
2/ Same plots in log-log scale. #Bitcoin appears to currently be in a bubble. Bubbles ultimately deflate in an anti-bubble.
3/ Sornette models bubbles in financial markets with time based power laws that have a critical time point in the future. Price accelerates rapidly when approaching this critical time point, reaching a singularity at the critical point. en.wikipedia.org/wiki/Didier_So…