How to get URL link on X (Twitter) App


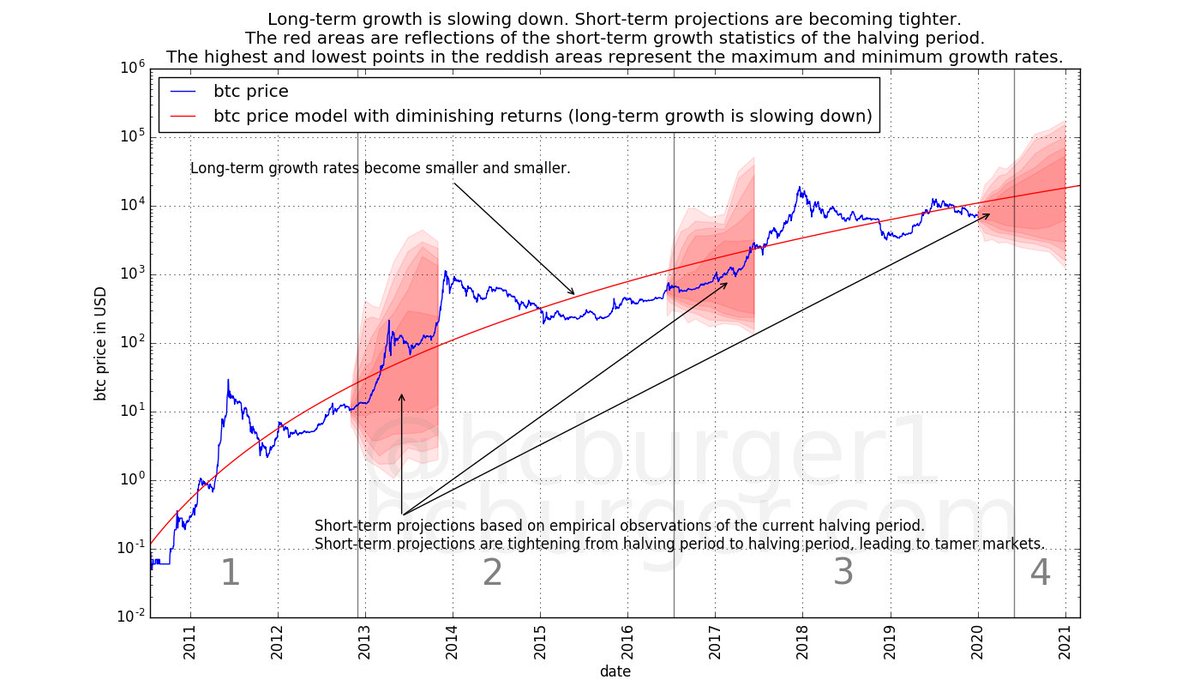
 The fact that the two fits are virtually identical means that the price action between September 2019 and now was perfectly in line with the 2019 model's expectations. From the model's point of view, nothing very interesting has happened! The new model is even a tad more bullish.
https://twitter.com/crypto_padawan/status/1537500127333478400It seems to be implied that because #btc has never dropped below the 200 WMA (so far), it presents a good support level. Yet that doesn't take into account diminishing returns.
https://twitter.com/100trillionUSD/status/1536352056671354880?s=20&t=OxaBPQlopOg2e7ne1046UA


 A drop in price is of course not fun. But current prices are not something that should concern us from a fundamental perspective. We are in line with expectations (which have been set in the past, empirically).

https://twitter.com/davthewave/status/1483514480520986624?s=20&t=RscG_PC-w1-4EUcHFhciKg

 Let's first look at the raw data points of @davthewave's corridor, using both a linear and a log time scale. Observations:


 2. #btc just came out of a bull market.


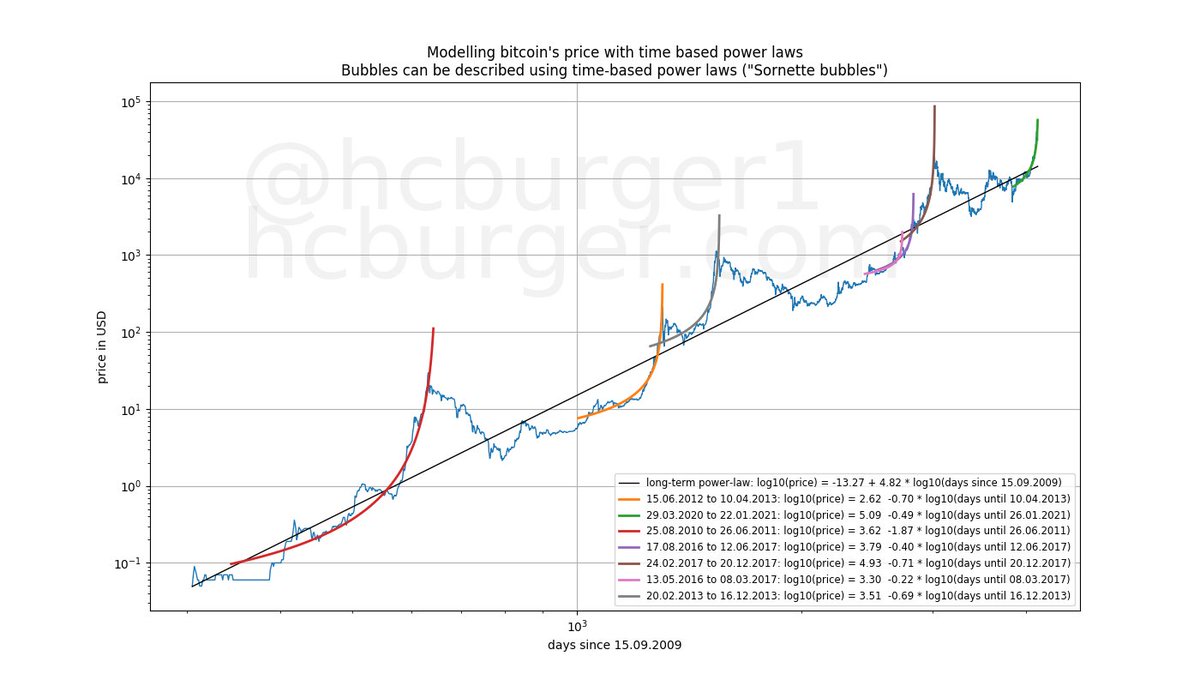
 2/ Same plots in log-log scale. #Bitcoin appears to currently be in a bubble. Bubbles ultimately deflate in an anti-bubble.


