In advance of our work on excess deaths coming out in the next day or so, and with quite a few new followers, I thought I'd do a thread on how we calculate our baseline predicted values for 2022, and how these compare to what the ABS uses.
#COVID19Aus
#COVID19Aus
What did we do? We used ABS standardised death rates (SDRs) for each cause of death as the basis of our projections. The SDRs allow for changes in both population size and age mix. We built in trends for mortality improvement. We then converted that back to numbers of deaths.
What do ABS do? They use the average number of deaths in 2017-19+21 without any adjustment for population changes or trend.
Hopefully this graph (for cancer deaths) demonstrates the difference.
Deaths (blue bars) have been growing each year while SDRs (orange line) have been declining i.e. higher deaths due to population growth/aging have outstripped reductions in deaths due to mortality improvement.
Deaths (blue bars) have been growing each year while SDRs (orange line) have been declining i.e. higher deaths due to population growth/aging have outstripped reductions in deaths due to mortality improvement.
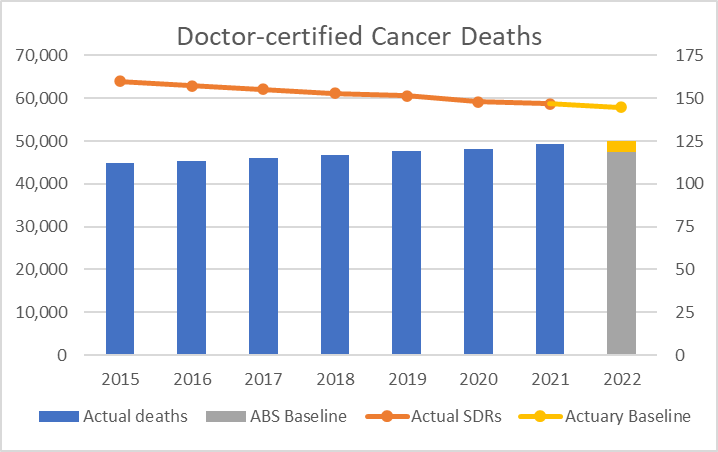
The ABS baseline for 2022 (grey bar) is the same as the actual number for 2019, and lower than 2020 and 2021. Anyone else think it looks too low?
Our baseline assumes that mortality trend will continue into 2022, and results in a number of deaths that is 5% higher than 2021.
Our baseline assumes that mortality trend will continue into 2022, and results in a number of deaths that is 5% higher than 2021.

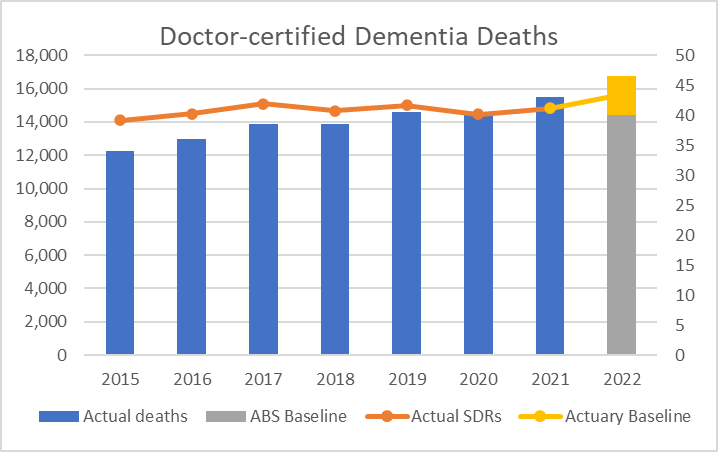
Here's the same graph for dementia deaths. ABS too low?
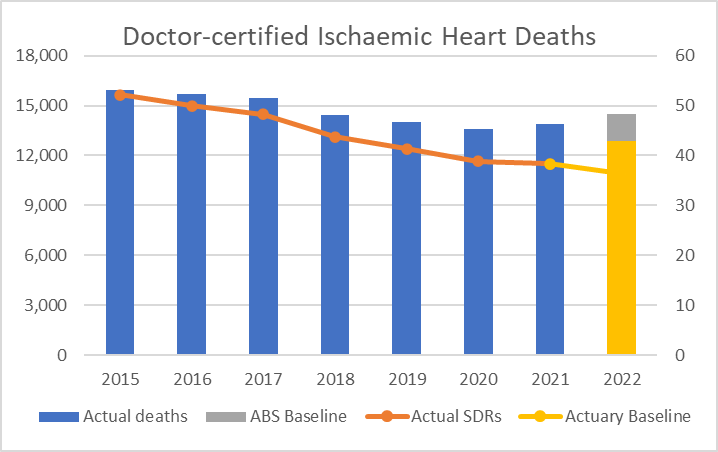
And for ischaemic heart disease.
For heart disease, mortality improvement has been very high, resulting in a declining number of deaths each year. Here the ABS baseline looks too high.
For heart disease, mortality improvement has been very high, resulting in a declining number of deaths each year. Here the ABS baseline looks too high.
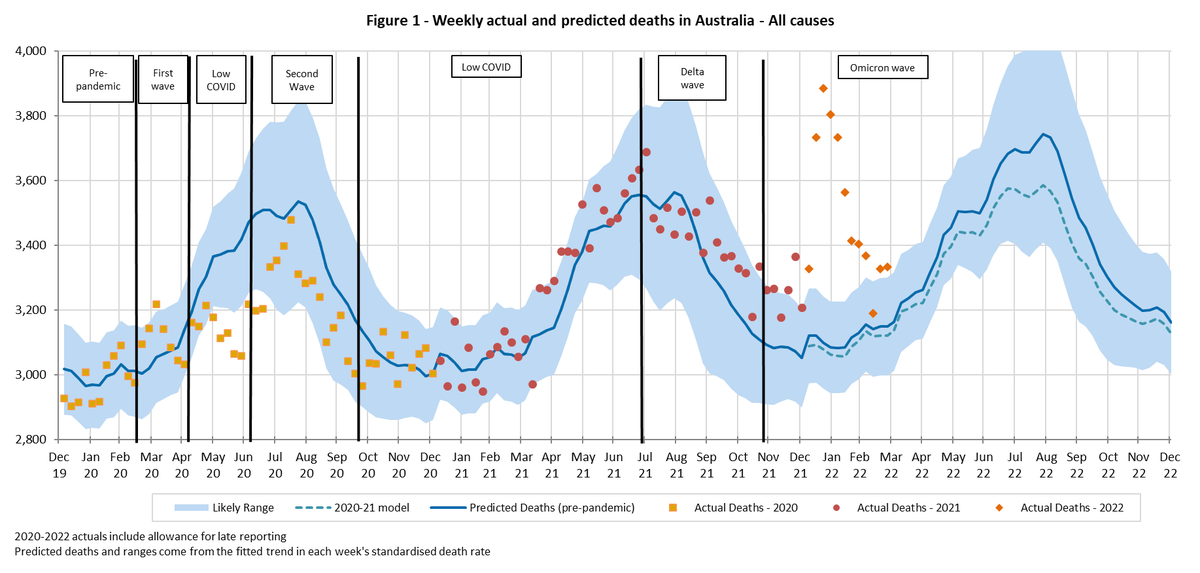
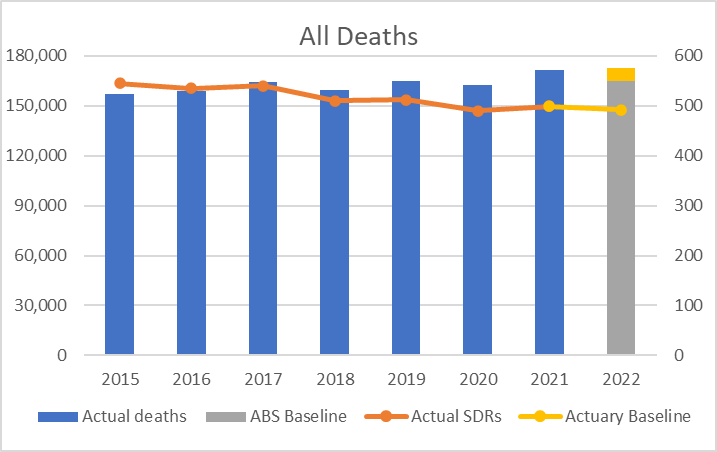
For completeness, here is what the graph for all deaths looks like.
To be fair to the ABS, they do quote some SDRs in their commentary and I think they quite carefully do not refer to "excess deaths".
However, this is not how everyone reads there publications!
However, this is not how everyone reads there publications!
Our aim was to have predicted values that represented deaths “in the absence of the pandemic” so any excess could be attributed to the pandemic.
So our baseline includes no COVID-19 deaths (there would be none if no pandemic).
So our baseline includes no COVID-19 deaths (there would be none if no pandemic).
For respiratory disease and dementia, we used the 2015-2019 years only in forming our baseline. These causes were heavily impacted (in a good way) by the measures introduced to limit COVID-19 in 2020 and 2021, hence we ignored these years.
For all other causes other, we used all the years (2015-2021) to set the baseline. Deaths from these causes were largely unaffected by the pandemic in 2020 and 2021.
Hopefully that makes sense (I wrote this is a bit of a hurry!)
The end. Any questions?
The end. Any questions?
I’m very annoyed at myself for using “there” instead of “their”. Where’s my edit button?!
For those who might want a more technical explanation of how we got to our baseline, you can find it in this blog.
actuaries.digital/2022/06/08/cov…
actuaries.digital/2022/06/08/cov…
• • •
Missing some Tweet in this thread? You can try to
force a refresh