Arca.bull Profile picture
Aug 5 9 tweets 5 min read
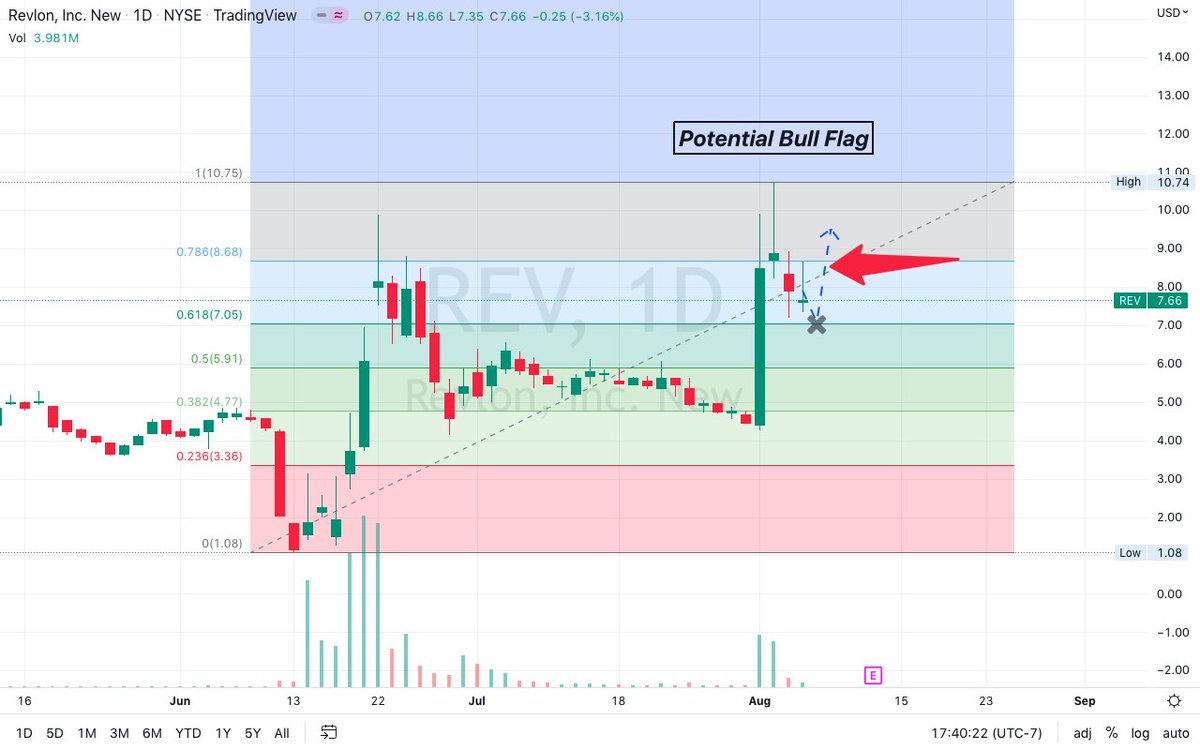
$REV-Continuation PT 2: the #bullflag we mentioned in yesterdays TA looks to be playing nicely. We would need to break through the daily SMA200 and confirm support to move to the upside... cont
$REV-Continuation PT 3: I expect a continuation down to the 0.618 #fibonacci ratio ($7.05) to bounce passed the 0.786 ($8.68) to continue onto the 1 fib ($10.75). Confirming support at the $10.75 level can take us to interesting levels... cont
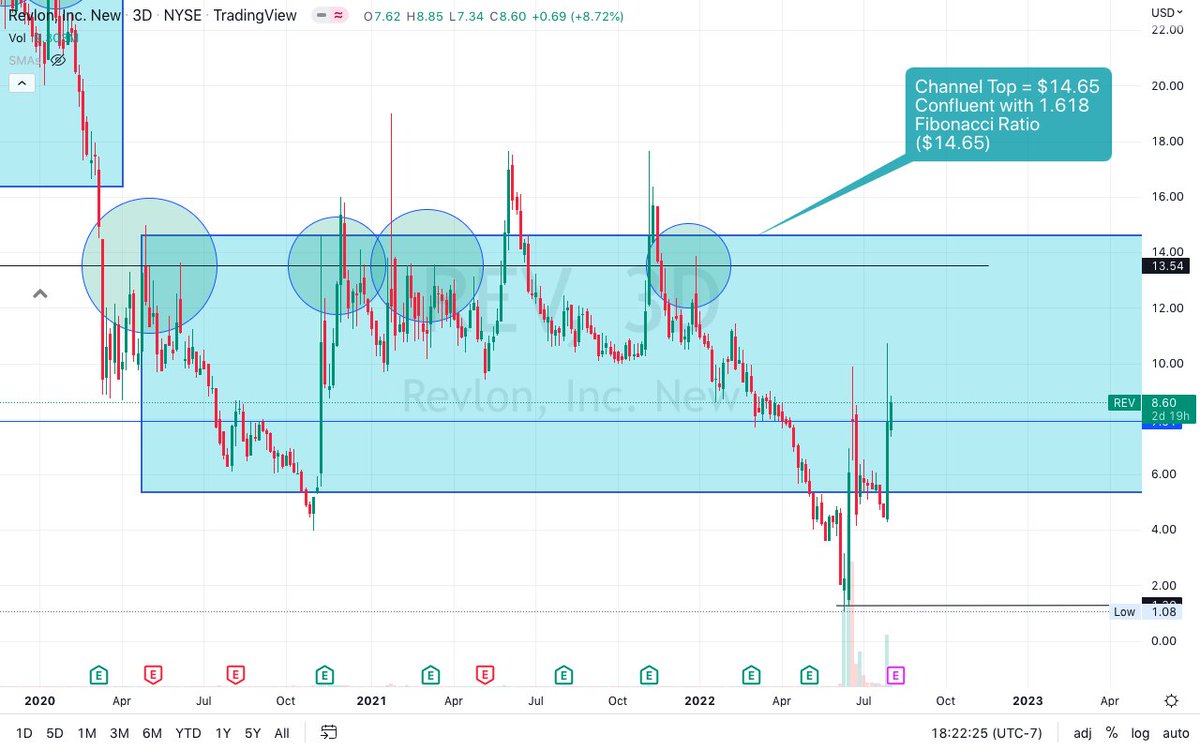
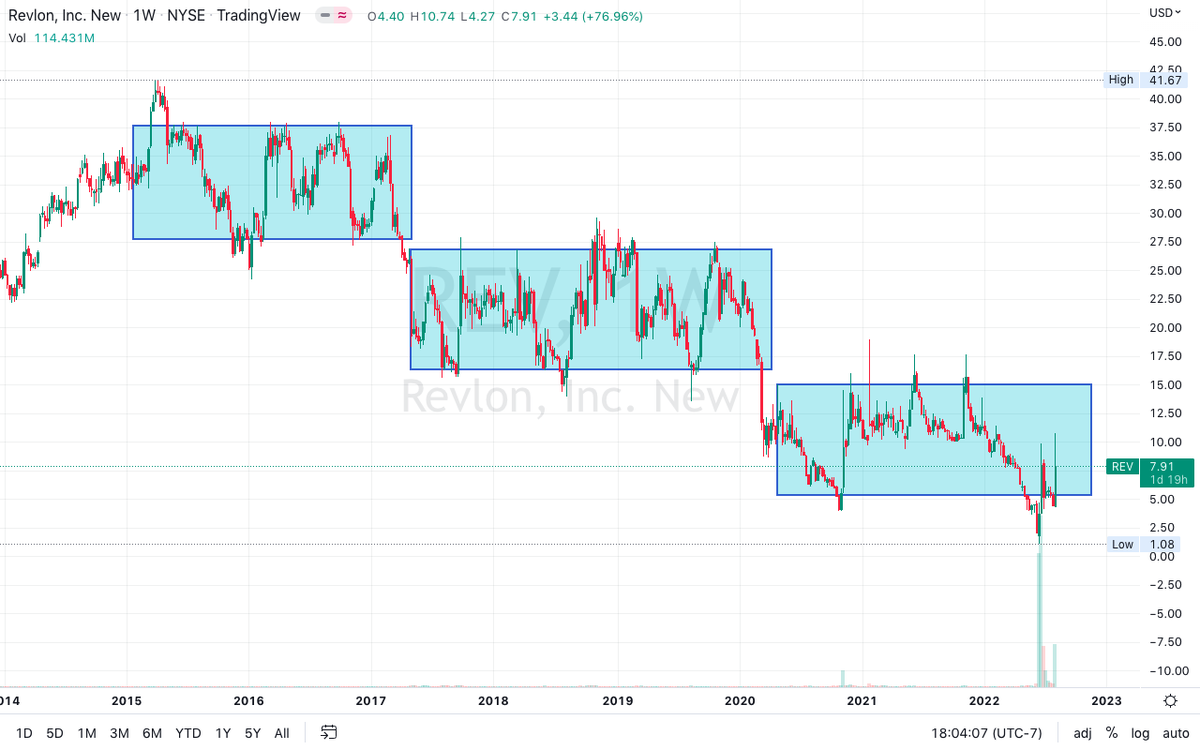
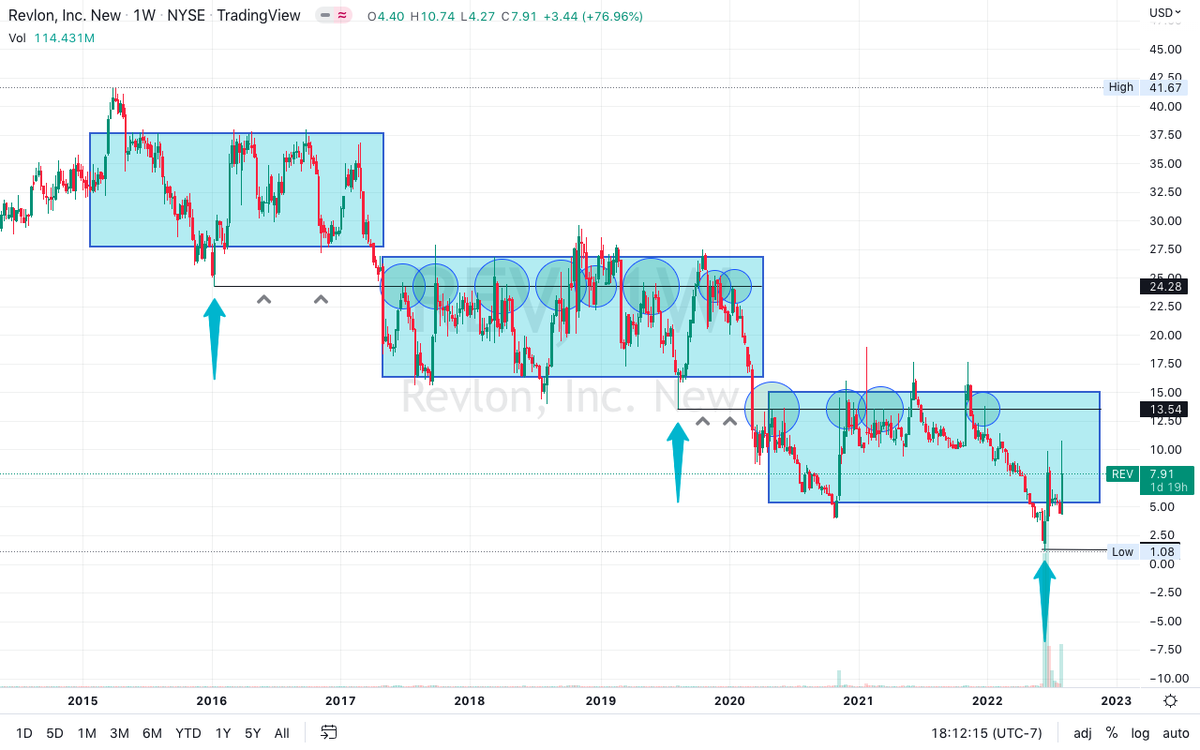
$REV-Continuation PT 4: There is massive confluence @ the 1.618 Golden ratio ($14.65). In order for me to show you exactly how that ratio can be met we'd have to change the perspective of the weekly capitulation phases... Cont
$REV-Continuation PT 5: In reviewing yesterdays analysis i came across a MASSIVE descending channel. The top of this channel is confluent with the 1.618 golden ratio. Due to this find, i decided to also measure the top of our current capitulation phase... cont
$REV-Continuation PT 6: To my surprise, our current iteration also has a top of the $14.65 #fib ratio and the descending channel. We can see that #rev has the power to rally to the top of these channels based on previous price action.... cont
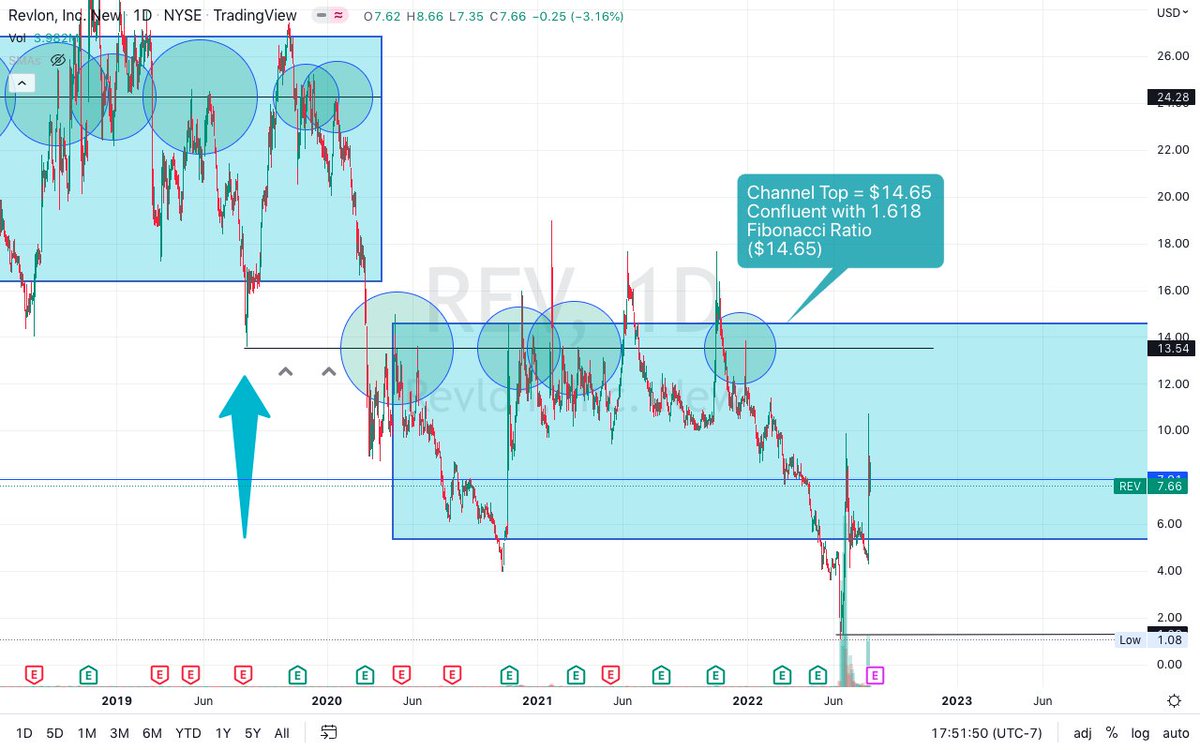
$REV-Continuation PT 7: A reasonable mount of time to realize this channel top would be by October 3rd, 2022. The charts are suggesting a future possible rally. Any negative catalyst can change this outlook and have us realize our third capitulation phase... cont
$REV-Continuation PT 8: Although the phases suggest continuation down, the phases are also based on weekly candles, meaning there is still time to rally before a massive sell off. Please keep in mind that nothing is certain. I'm bullish btw. Thank you as always

-ArcaB
@Dozer8210 @Kazi5isAlive i have a new outlook for you to review. I may have missed this last night but we caught it now.
@Dozer8210 @Kazi5isAlive Based on yesterday's analysis 👌

• • •

Missing some Tweet in this thread? You can try to force a refresh
 

Keep Current with Arca.bull

Arca.bull Profile picture

Stay in touch and get notified when new unrolls are available from this author!

Read all threads

This Thread may be Removed Anytime!

PDF

Twitter may remove this content at anytime! Save it as PDF for later use!

Try unrolling a thread yourself!

how to unroll video
  1. Follow @ThreadReaderApp to mention us!

  2. From a Twitter thread mention us with a keyword "unroll"
@threadreaderapp unroll

Practice here first or read more on our help page!

More from @arcabulls

Aug 6
$MEGL vs $HKD PT 1: I hate when this happens. #megl #stock #cupandhandle may not be done just yet, let's begin. I began to notice the odd behavior from megl today in price action. I was curious so i began to compare #IPO's with #hkd. I noticed some rhyming... cont
$MEGL vs $HKD PT 2: Let's take a #fibonacci retracement from the first candle to the low of the day. You'll see we faced rejection @ the 1.618 ratio. Now let's take some fibs from the top of the cup to the low of the day and we can now see some higher targets that... cont Image
$MEGL vs $HKD PT 3: ... have more to do with #hkd #stock. before we go there let's take note that our second trading day first stop could be at #megl's all time high based on the patterns target via trend lines explained in the pt 1 video... cont Image
Read 6 tweets
Aug 6
$REV-Playout PT 1: Our previously implied #bullflag is playing out like we said. During the after hours today, we came retraced to re-test the 0.618 #fibonacci ratio ($8.27) and have now closed the day at $8.35. This tells us that #rev #stock is respecting market geometry... cont Image
$REV-Playout PT 2: Price action is suggesting what we previously mentioned, #rev may want to continue in this phase for some more time and potentially reach the channel top before the next capitulation phase starts... cont Image
$REV-Playout PT 3: On our first #rev #stock post, we found hidden bullish divergence in the daily #RSI indicator and it worked out nicely. We can still go into a more overbought zone before driving down... cont Image
Read 6 tweets
Aug 6
$RDBX-New Formation PT 1: The daily 10 day simple moving average is acting as support from today's run. Confirming support above this average can prove worthy for #rdbx #stock. The real obstacle would be the cross of the daily SMA100 right after... cont Image
$RDBX-New Formation PT 2: The bottom rectangular support we've had for days is working perfectly and is also helping form our previously implied #bullflag formation. This candle will close in 2 trading days and still within the channel bounds... cont Image
$RDBX-New Formation PT 3: Daily #RSI indicator is pivoted straight up and about to re-enter the bullish control zone. The moving average seems to have worked as a form of support... cont Image
Read 8 tweets
Aug 4
$BBBY-Formation Confirmed PT 1: The SMA100 played the support just like we spoke about yesterday. In doing so, the pattern became more apparent. To gain an edge on an area for either take profit or interest, let's take some #Fibonacci targets... cont Image
$REV-Macro Perspective PT 2: Our implied pattern is a #cupandhandle. We mentioned yesterday that we'd be able to form this candle only if we found support off of the 100 day simple moving average... cont Image
$REV-Macro Perspective PT 3: We can see through #fib levels that #BBBY is respecting market geometry. Based on previous areas of supports and resistances, our first stop would be $6.36 and then our 1 fib ratio @ $6.52. maintaining support at our 0.618 fib ($5.71) can...cont Image
Read 5 tweets
Aug 4
$REV-Macro Perspective PT 1: Let's take note of our macro direction. We can see on the weekly time frame that #rev #stock is playing iterations of capitulation phases. There's still be room to continue the last iteration longer. There's something we should note here... cont Image
$REV-Macro Perspective PT 2: In each of these iterations we have wicked to new lower low and #rev has used that lower wick as an area of interest and resistance before capitulating again. Our current iteration has made a new lower wick... cont Image
$REV-Macro Perspective PT 3: The reason we may play the current iteration longer is due to the support marked to the left with a red arrow from back in 2006! This backs our next thread of analysis... cont Image
Read 8 tweets
Aug 4
$RDBX-Before We Run PT 1: We have touched down at the bottom of both our channel and ascending triangle formations. Keep in mind that this drop has been spoken of for days now and we're pretty much where we said we'd be. This introduces a support range... cont Image
$RDBX-Before We Run PT 2: We have a support ranging from $3.63 to $4.23. Falling to the $3.63 bottom would still keep us in our higher high and higher low basis... cont Image
$RDBX-Before We Run PT 3: Our 3 Day #BBWP #indicator is running higher into the extreme highs. This can give us a clue into the incoming buy pressure. It appears as though there can be enough fuel in the coming days for a serious run to the upside... cont Image
Read 8 tweets

Did Thread Reader help you today?

Support us! We are indie developers!


This site is made by just two indie developers on a laptop doing marketing, support and development! Read more about the story.

Become a Premium Member ($3/month or $30/year) and get exclusive features!

Become Premium

Don't want to be a Premium member but still want to support us?

Make a small donation by buying us coffee ($5) or help with server cost ($10)

Donate via Paypal

Or Donate anonymously using crypto!

Ethereum

0xfe58350B80634f60Fa6Dc149a72b4DFbc17D341E copy

Bitcoin

3ATGMxNzCUFzxpMCHL5sWSt4DVtS8UqXpi copy

Thank you for your support!

Follow Us on Twitter!

:(