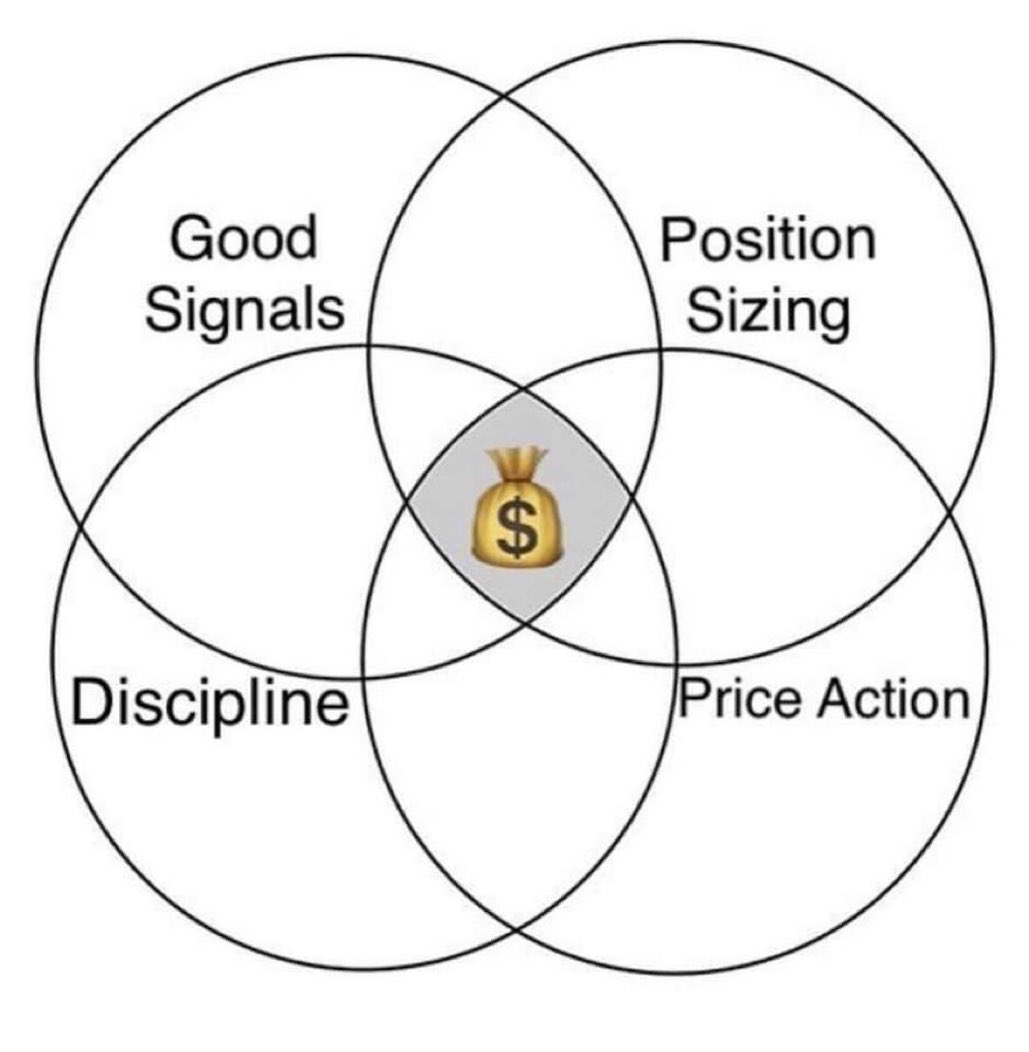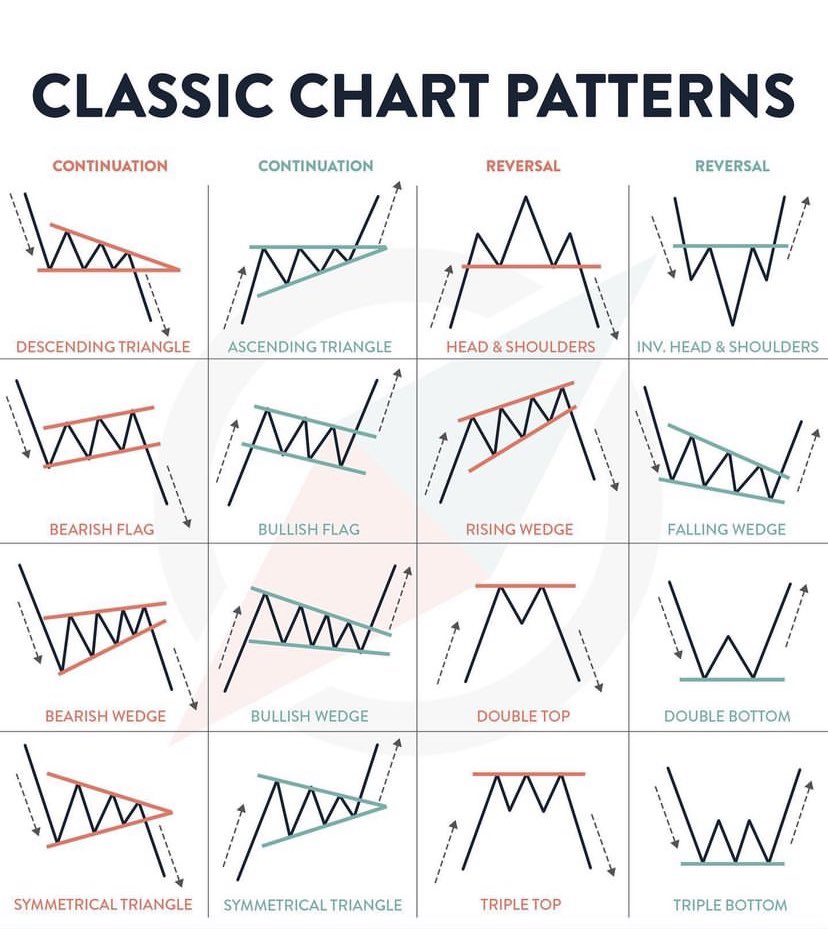
Are you a good stock market trader?
Become better & improve yourself
😎💡📈📊💰
#trading #learning #StockMarket
Become better & improve yourself
😎💡📈📊💰
#trading #learning #StockMarket

How single #Candle patterns are working to generate Highly profitable signals in trading?
Learn Here 👇👇
Learn Here 👇👇

• • •
Missing some Tweet in this thread? You can try to
force a refresh


