Sept 7: AB COVID-19 data round up
Disclaimer: I base my graphs off of Alberta Health's raw data. The data they release weekly includes changes made to past weeks. I update my graphs to reflect those changes which is why my numbers may be different than others. #COVID19AB #Yeg
Disclaimer: I base my graphs off of Alberta Health's raw data. The data they release weekly includes changes made to past weeks. I update my graphs to reflect those changes which is why my numbers may be different than others. #COVID19AB #Yeg
Tests: 6719 (-841 less than last week)
Last weeks test numbers were retroactively changed from 7547 up to 7560. #COVID19AB #Yeg
Last weeks test numbers were retroactively changed from 7547 up to 7560. #COVID19AB #Yeg
Avg Positivity: 16.68% (-2.25 from last week)
Last week's avg positivity was modified from 18.77% up to 18.93%.
#COVID19AB #Yeg
Last week's avg positivity was modified from 18.77% up to 18.93%.
#COVID19AB #Yeg

Deaths: 15 deaths reported this week
+1 to the week of July 5
+1 to the week of Aug 9
+3 added to the week of Aug 16
+22 added to last week (bringing last weeks deaths from 11 up to 33 total).
#COVID19AB #Yeg
+1 to the week of July 5
+1 to the week of Aug 9
+3 added to the week of Aug 16
+22 added to last week (bringing last weeks deaths from 11 up to 33 total).
#COVID19AB #Yeg

Hospitalized: 799 (-83 less than last week)
Last weeks hospitalizations were retroactively modified from 857 up to 882.
#COVID19AB #Yeg
Last weeks hospitalizations were retroactively modified from 857 up to 882.
#COVID19AB #Yeg

ICU: 20 (-1 less than last week)
Last weeks ICU number was retroactively updated from 20 down to 19.
#COVID19AB #yeg #yyc
Last weeks ICU number was retroactively updated from 20 down to 19.
#COVID19AB #yeg #yyc

New cases: 1084 (-271 less than last week)
The number of new cases for last week were retroactively changed from 1367 down to 1355.
#COVID19AB #yeg #yyc
The number of new cases for last week were retroactively changed from 1367 down to 1355.
#COVID19AB #yeg #yyc

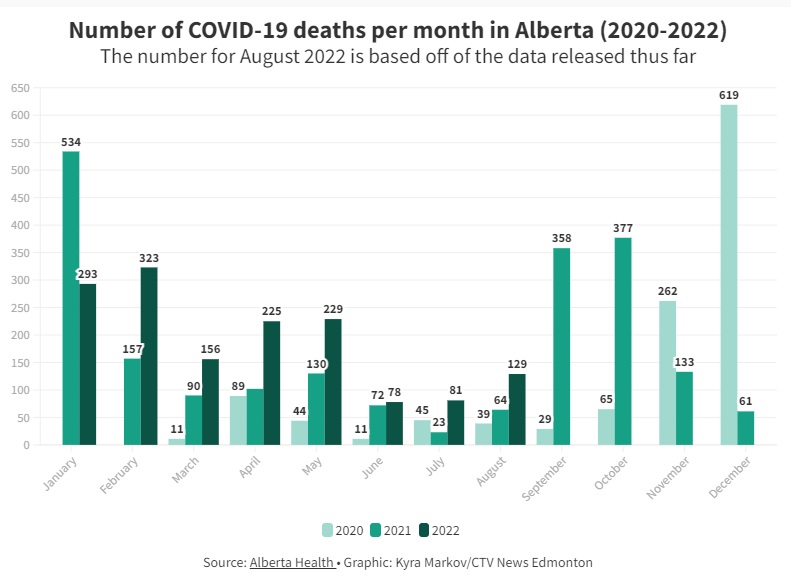
Actual number of deaths per month, year over year. August's data is now complete. There were 129 deaths. There were more deaths than last month, and more than both August 2021 and 2020. 

Sorry it was quite late tonight, very busy news wise the last few days! But hope this helps.
• • •
Missing some Tweet in this thread? You can try to
force a refresh


