Janis Kluge Profile picture
Sep 8 12 tweets 5 min read
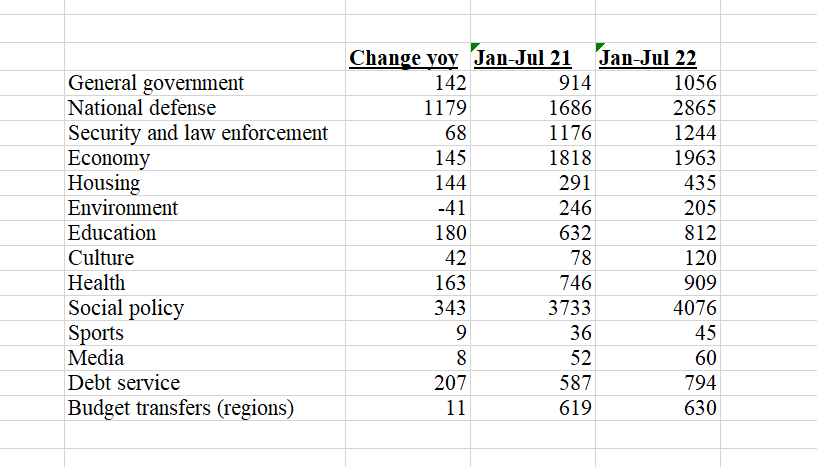
1/ #Russia's Finance Ministry stopped publishing detailed data #budget spending in April. But with a few calculations, it's possible to get a pretty good picture of what's going on. Due to the war, #defense spending until July was at least ~1.2tn RUB (~20bn USD) higher than 2021.
2/ This also means that defense spending until July was >1tn higher than planned. Of course this does not account for changes in Russia's stocks of weapons and ammunition. Refilling those will be much more expensive, but it was not yet visible in the budget until July 2022.
3/ Here is how defense spending can be calculated: Russia does not publish detailed monthly spending data, but they still publish a current snapshot on ongoing spending on "budget.gov.ru". The data here is incomplete, a huge chunk is missing.
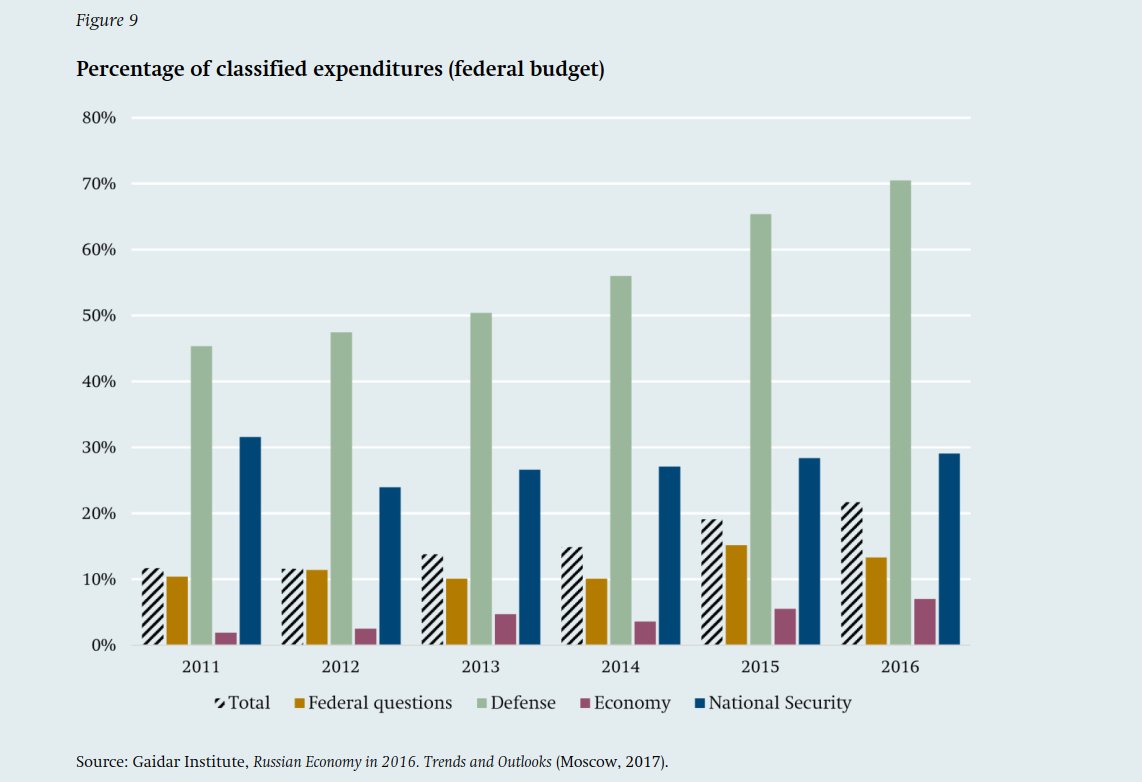
4/ What is missing is (apparently) the classified spending. Before April, the MinFin published the budget lines including classified spending. But we know very well where the classified spending usually goes to, and we know its amount (WAY up this year).
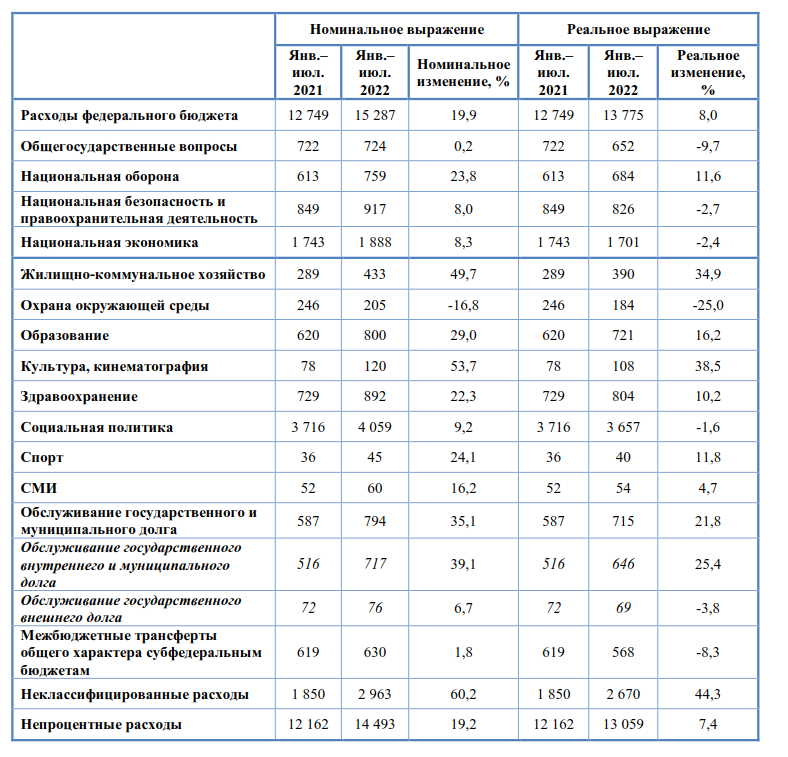
5/ Most of classified spending - unsurprisingly - goes to National Defense. For example, all spending on arms procurement is classified. There is some classified spending in National Security, Economy, and General Govmt, but that is about it. Chart from: swp-berlin.org/en/publication…
6/ Because we know the unclassified spending and we know the monthly total spending (MinFin still publishes that), we can calculate classified spending. We also know the normal distribution of classified spending, so we can infer how the budget looked like until July.
7/ We just have to distribute the classified spending (3tn so far this year) to the budget lines. There are two plausible ways: Either each budget line gets the same % of classified spending as it had last year. Or each line gets the same nominal amount and defense gets the rest.
8/ I find the latter one more plausible, because the huge increase in classified spending is definitely war-related (see numbers below). The result: Defense is 2.9tn until July. If you distribute classified spending according to last year's %, the result is similar: 2.6tn.
9/ The full-year defense budget was supposed to be 3.5tn RUB in 2022, but that will probably be surpassed in August/September. For the full year, something around 5-6tn RUB is realistic. The biggest chunk always comes in December.
10/ It is possible to cross-check the 2.9tn defense spending with alternative measures: In March and April, defense spending was (officially) ~0.5tn per month. If we add 0.5tn per month to the last known April total (1.6tn), the result is 3.1tn for defense spending until July.
11/11 I expect war costs to go after July, because arms manufacturing has ramped up (there are some signs of it in production statistics - another story). As long as MinFin publishes total spending figures, it will not be hard to figure out the federal budget's war spending.
PS: It was Gurvich's "Ekonomicheskaya Ekspertnaya Gruppa" (eeg.ru) who pointed me to the fact that there is still data available, just not for all spending. They publish a monthly overview of the incomplete spending data.

• • •

Missing some Tweet in this thread? You can try to force a refresh
 

Keep Current with Janis Kluge

Janis Kluge Profile picture

Stay in touch and get notified when new unrolls are available from this author!

Read all threads

This Thread may be Removed Anytime!

PDF

Twitter may remove this content at anytime! Save it as PDF for later use!

Try unrolling a thread yourself!

how to unroll video
  1. Follow @ThreadReaderApp to mention us!

  2. From a Twitter thread mention us with a keyword "unroll"
@threadreaderapp unroll

Practice here first or read more on our help page!

More from @jakluge

Sep 3
1/ Is #Russia flaring gas on a massive scale? Here is another approach to solving that question: Natural gas and gas condensate production should normally go hand in hand. Here is a dot plot of Russian monthly production of gas and gas condensate (unstabilized) until April 22.
2/ The correlation is strong, as expected (r=0.85). My assumption is that gas condensate doesn't have to be flared, because it is easier to store than natural gas. Thus, if #Gazprom is reducing its production by flaring the correlation should break down.
3/ If #Gazprom is reducing its production by shutting down wells, the correlation should rather remain intact (less condensate production). Gazprom's natural gas production started falling dramatically in April.
Read 5 tweets
Sep 1
1/ Most economic indicators in #Russia's monthly statistics have stabilized. One exception: The crash in wholesale turnover seems to be continuing unabated. Wholesale turnover has fallen by 25.4% year over year! What's happening? Spoiler: It's Putin's gas blackmail backfiring. 1/
2/ Rosstat hasn't published the individual components of wholesale turnover in absolute terms (at least I couldn't find it), but it is possible to calculate them based on the relative weight of different sectors, which Rosstat publishes.
3/ Here is the resulting wholesale turnover (in current prices). There are some seasonal changes (not important here). Important is the general role that different sectors play. Wholesale turnover is dominated by raw materials, more precisely: energy trade.
Read 8 tweets
Aug 30
1/ Explainer: Why the timing of a crisis has a critical impact on annual GDP figures. Annual GDP depends very much on one thing: In which quarter did the crisis start? These are 4 _identical_ economic crises with subsequent recovery. They start 3 months apart.
2/ Now let's look at the result change in annual GDP in the first 3 calendar years of these hypothetical crises: The difference that a 3-month delay makes!
#Russia's current crisis started in Q2 (~red). If Russia had started its war 3 months earlier, we would be looking at ~blue.
3/ The drop in Russian GDP during the Global Financial Crisis fit neatly into the year 2009, resulting in a 7.8% contraction, with growth in 2008 and 2010. It is just this _coincidence_ that makes 2009 look so harsh, and 2022 look rather benign.
Read 4 tweets
Aug 26
1/ Is #Gazprom flaring on a massive scale? I am reopening the case! The flare near #Finland is huge, but it can only burn ~1% of the missing delivieres. BUT: What if there are more? Quite possibly, Gazprom's declining production numbers are actually a _result_ of flaring.
2/ In recent weeks, NASA FIRMS was sometimes used to assess the intensity of artillery in Ukraine. It can also be used to detect flaring. The big flame near Finland appeared for the first time on June 17th. Since then the satellite shows it clearly. firms.modaps.eosdis.nasa.gov/map/#t:adv;d:2…
3/ I checked some places near Novy Urengoy, famous for its gas production. And the first installation I looked at was an immediate hit: It was this flare stack in the East of Novy Urengoy. I went through the last years, and there was only a little activity in late '20/early '21.
Read 6 tweets
Aug 19
There is one key contradiction in the Kremlin's propaganda about the war that could eventually become a problem. On the one hand, Putin wants the population to ignore what's happening, live their lives undisturbed, and be cynical or ignorant. 1/
On the other hand, the justification for the war and the costs associated with it is highly normative: It is supposedly about saving the people in Donbas, protecting them, fighting against Nazis etc. The justification tries to allure to values. /2
You could call this propaganda differentiation - Russians can pick the reality they like. Either its just a military operation, nothing to worry about... or it is essentially the continuation of the Great Patriotic War, and a moral or even existential duty for Russia to fight. /3
Read 6 tweets
Aug 18
1/ Der einzige relevante, aktuell (seit einigen Tagen) sanktionierte Energieträger aus Russland ist Kohle. Diese Sanktion erhöht den Kohlepreis. Das ist allerdings eher für die Profite der Energiekonzerne ein Problem als für die Verbraucher. Hier eine sehr vereinfachte Grafik:
2/ Der Strompreis ist ein Marktpreis, d.h. er wird von dem Anbieter mit dem höchsten Grenzkosten bestimmt. Aktuell sind das Gaskraftwerke. Die Betreiber von Erneuerbaren/Kohle/Atom etc. können sich freuen, weil es ihre Margen erhöht.
3/ Solange Gas aus Strom notwendig ist, spielt der Kohlepreis für den Strompreis keine Rolle. Die Kohle könnte kostenlos sein, es würde den Strom nicht billiger machen. D.h. in dieser Situation haben die Sanktionen keinen negativen Effekt für die meisten Stromkäufer.
Read 11 tweets

Did Thread Reader help you today?

Support us! We are indie developers!


This site is made by just two indie developers on a laptop doing marketing, support and development! Read more about the story.

Become a Premium Member ($3/month or $30/year) and get exclusive features!

Become Premium

Don't want to be a Premium member but still want to support us?

Make a small donation by buying us coffee ($5) or help with server cost ($10)

Donate via Paypal

Or Donate anonymously using crypto!

Ethereum

0xfe58350B80634f60Fa6Dc149a72b4DFbc17D341E copy

Bitcoin

3ATGMxNzCUFzxpMCHL5sWSt4DVtS8UqXpi copy

Thank you for your support!

Follow Us on Twitter!

:(