One of the least talked topics in stock market is Winning Probability, Risk Management and Position Sizing.
Holy grail does exist but it's not a strategy. Its mindset. Ever wondered why top traders despite different trading styles average between 4-8% returns pm?
A Thread 🧵
Holy grail does exist but it's not a strategy. Its mindset. Ever wondered why top traders despite different trading styles average between 4-8% returns pm?
A Thread 🧵
Key to good trading is understanding your:
1. Winning Probability - How many trades you win out of 100?
2. Risk Management - How much you lose vs how much you win. Risk:Reward?
3. Position Sizing - How much quantity you execute which impacts your loss / profit?
1. Winning Probability - How many trades you win out of 100?
2. Risk Management - How much you lose vs how much you win. Risk:Reward?
3. Position Sizing - How much quantity you execute which impacts your loss / profit?

What are the benchmarks of good returns for your trading style?
1. Investors look for 16-18% compounded returns.
2. Swing Traders are looking at 18-30% returns with passive trading and investing.
3. Traders across spectrum look at 4-8% per month in general.
But question is..
1. Investors look for 16-18% compounded returns.
2. Swing Traders are looking at 18-30% returns with passive trading and investing.
3. Traders across spectrum look at 4-8% per month in general.
But question is..
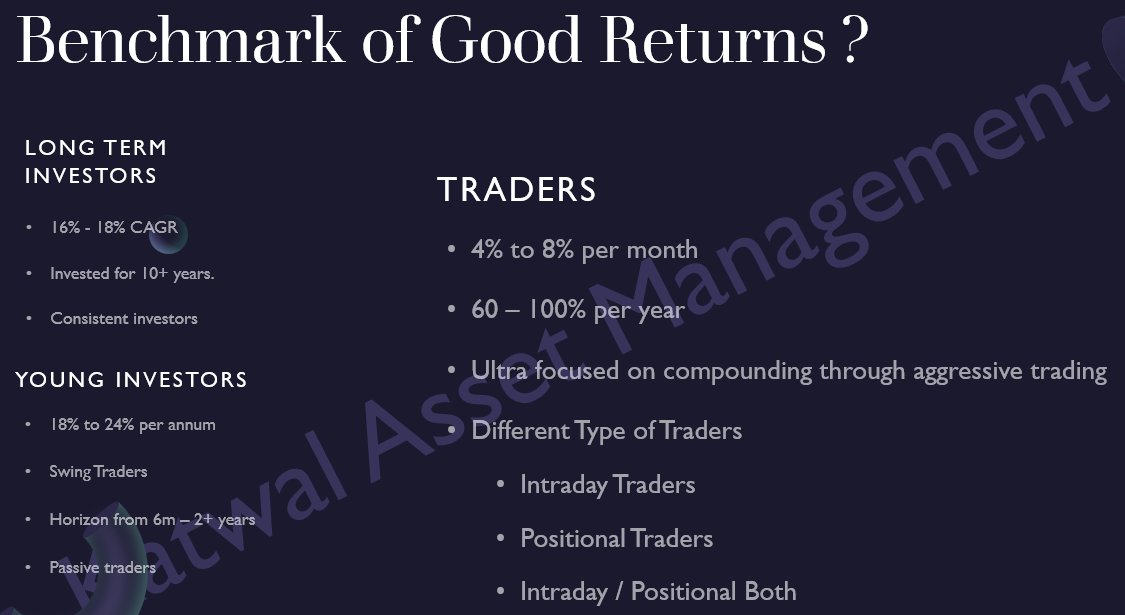
Considering Traders, all these traders have different:
1. Trading Styles
2. Time Frames
3. Technical Analysis
4. Execution
Yet profit varies from the range of 4-8% even for best of traders. From options perspective some are trading ITM/OTM/ATM, then why this generalization?
1. Trading Styles
2. Time Frames
3. Technical Analysis
4. Execution
Yet profit varies from the range of 4-8% even for best of traders. From options perspective some are trading ITM/OTM/ATM, then why this generalization?

#FoodForThought
Every trader has developed into his/her trading style an understanding of Risk Management and proper position sizing. That's why a trader selling ITM options of Rs. 500 and another selling OTM at Rs. 40 are yielding overall same results on total capital.
Every trader has developed into his/her trading style an understanding of Risk Management and proper position sizing. That's why a trader selling ITM options of Rs. 500 and another selling OTM at Rs. 40 are yielding overall same results on total capital.

Which busts another myth around trading that has been propagating. If you trade ITM/ATM then you are a real trader. If you are trading selling cheap options, you are not a trader. Which is wrong at so many levels. I know great traders making a living through either ATM/ITM/OTM.
Understand difference between OTM/ITM/ATM and select your niche.
OTM Traders
- Pure Theta Decay due to 100% extrinsic value & lesser delta
- Only Selling
- Safety in distance and hedging
- Bigger position size
- Total ROI / Trade ROI based Stop Loss
- Win probability is ~70%
OTM Traders
- Pure Theta Decay due to 100% extrinsic value & lesser delta
- Only Selling
- Safety in distance and hedging
- Bigger position size
- Total ROI / Trade ROI based Stop Loss
- Win probability is ~70%

ATM Traders
- Directional Play and Big Theta Decay as maximum theta at ATM Options
- More Trading less adjustments
- Stoploss based approach
- Moderate Trading quantity wrt total capital
- Winning probability around 50%+
- Buying/Selling can be done
- Directional Play and Big Theta Decay as maximum theta at ATM Options
- More Trading less adjustments
- Stoploss based approach
- Moderate Trading quantity wrt total capital
- Winning probability around 50%+
- Buying/Selling can be done

ITM Traders
- Pure Direction Play
- Maximum Intrinsic Value
- Stoploss and Target gets Bigger
- Position Sizing can get further less compared to others
- Winning Probability is 50% plus
- Ideal for Option Buyers/Sellers as less theta decay
- Pure Direction Play
- Maximum Intrinsic Value
- Stoploss and Target gets Bigger
- Position Sizing can get further less compared to others
- Winning Probability is 50% plus
- Ideal for Option Buyers/Sellers as less theta decay

Different traders can achieve different trading results with these parameters. Yet there are great traders who have outlier results then what is written but please understand that it needs world class trading skill in Options and takes years of practice.
Based on this, understand in attached image, how with different probability, risk management and position sizing all traders achieve an overall same result.
OTM / ATM / ITM have different Quantities, Win Probabilities and R:R have different win/lose but same net results.
OTM / ATM / ITM have different Quantities, Win Probabilities and R:R have different win/lose but same net results.

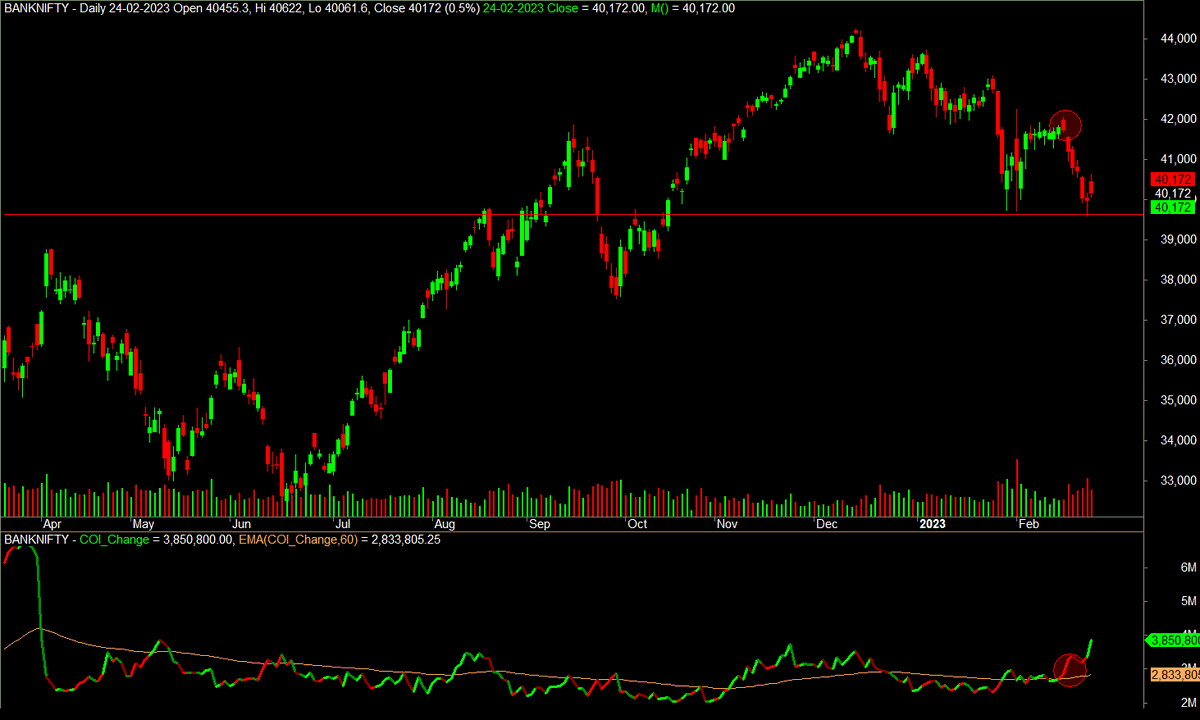
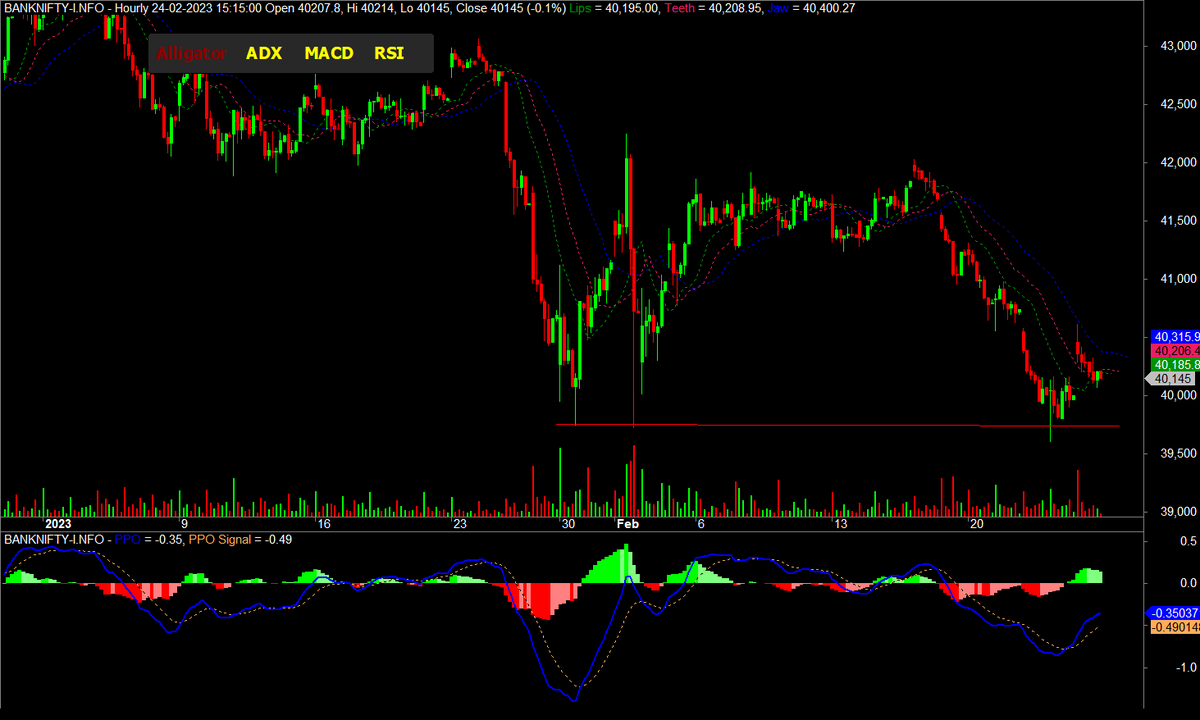
When you start developing a system, you look for an edge of indicator like MACD, RSI etc. but you should be often asking
- What is historical win rate of my signal
- In points, how much I lose wrt win
- How many signals I might get to tweak my quantity to take all trades...
- What is historical win rate of my signal
- In points, how much I lose wrt win
- How many signals I might get to tweak my quantity to take all trades...
...and if I hit my worst case scenario, will I be able to follow my trades over a bigger period of time, say 100 trades?
This is where holy grail of any trading strategy lies.
If you liked this thread, make sure to follow the author @rohit_katwal and retweet the first tweet.
This is where holy grail of any trading strategy lies.
If you liked this thread, make sure to follow the author @rohit_katwal and retweet the first tweet.
• • •
Missing some Tweet in this thread? You can try to
force a refresh