Inflation has many concerned, and it's a complex issue. So I'm happy to share some results of work with my colleague, Prof. Sonja Chen: papers.ssrn.com/sol3/papers.cf… Not yet peer-reviewed, but there's some interesting results I'll preview here. 🧵 #cdnecon #cdnpoli
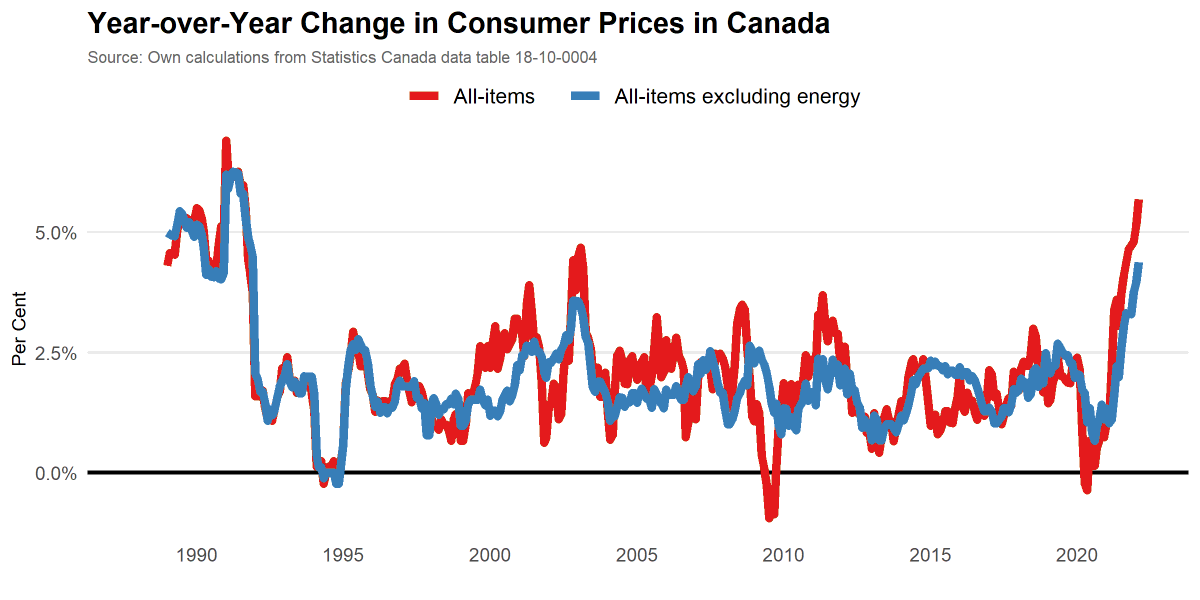
First, it's important to appreciate that rising inflation is accounted for by a few specific items. Had energy and shelter prices, for example, not increased then overall inflation would have been 4.1% in July rather than 7.8%. 

More interesting is the spillover effect of energy prices on other goods and services. We find roughly one-quarter of items move up and down strongly with oil prices. And those items account for 60% of the non-energy inflation we're seeing. 

This suggests to us that supply-side factors (i.e., the cost of producing goods and services) are potentially more important factor than demand (i.e., higher spending by individuals and businesses).
There's a broad debate about whether the inflation we're seeing is supply-driven or demand-driven.
Luckily, it may be possible to use data to tell the difference between the two. We try to do that in Canada following some recent work by Adam Shapiro: frbsf.org/economic-resea…
Luckily, it may be possible to use data to tell the difference between the two. We try to do that in Canada following some recent work by Adam Shapiro: frbsf.org/economic-resea…
The intuition is straightforward. If demand rises, then prices go up *and* quantities purchased goes up. But if prices are rising because of a supply shock, then prices go up but quantity goes *down*. en.wikipedia.org/wiki/Supply_sh… 

The trouble is CPI doesn't have good quantity data. But another data source that tracks CPI very closely does! We use that. It's the Canadian version of "PCE Inflation" in the United States. bea.gov/data/personal-… It has price and quantity data for ~100 items. 

Details in the paper linked to above if you're interested (and feedback is welcome!). The main results are clear: demand was a big factor early on (see 2021) but over the past few quarters the increases have been largely supply-driven! 

And for individual items, here's the top contributors to both demand-driven inflation and supply-driven inflation over the past year. Fuel and food appear to be supply-driven, and large contributors. Home owner costs ("imputed rent") top the demand-side list. 

This is important to understand. If true, then much of the underlying cause of recently accelerating inflation don't seem to be due to "money printing" as some might think, or government spending / income support programs.
This doesn't mean there isn't a role for policy -- both fiscal and monetary policy matter. And tighter monetary policy through raising interest rates is what central banks globally are doing now to bring inflation down. Will that be effective? We try to shed light on this too.
Separating items between those that are responsive to interest rates (based on bankofcanada.ca/wp-content/upl…) and items that generally have persistent price changes, we find a potentially encouraging result. 

What's this figure mean? It suggests that most of the high inflation is accounted for by items that tend to have just temporary price changes or are sensitive to interest rates (where demand is ~ half the issue). 

To be clear, this isn't a prediction about what will happen. But the analysis might be helpful to better understand what's going on today. Especially since much public commentary on inflation isn't as data-driven as a topic like this deserves.
Of course, lots more to understand and note this is not yet peer-reviewed so a referee may catch an error. (Feedback welcome; wonkier the better!)
But hopefully this is an interesting and informative early look. More in the paper: papers.ssrn.com/sol3/papers.cf… !
/fin
But hopefully this is an interesting and informative early look. More in the paper: papers.ssrn.com/sol3/papers.cf… !
/fin
• • •
Missing some Tweet in this thread? You can try to
force a refresh


