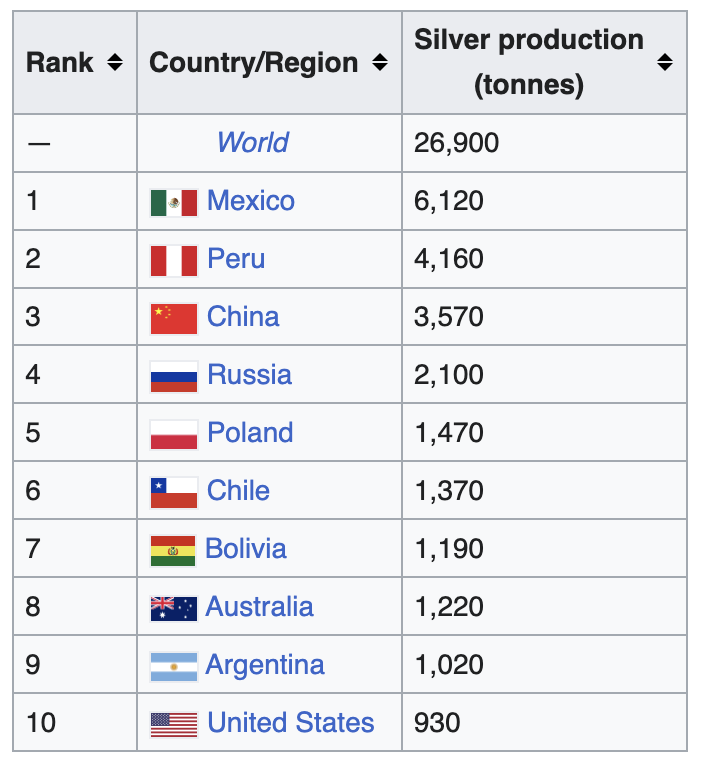
Last weekend, I covered why the energy crisis is driving an accelerating #silver supply-demand imbalance. Now, let’s take a shot at the WHEN question by taking a quick look at charts from the bears of the past, with the idea they may be prologue.
Note: I do NOT think I can time this with any precision. If my flip to bullishness in late August was the bottom, luck will have played a big factor. I have zero qualifications. I just like commodity markets. To the charts! 👇
Let’s start with the DotCom Bust.
#Gold found its bottom in Feb of 01, silver in Nov of 01, and the SP500 in Oct of 02.
#Gold found its bottom in Feb of 01, silver in Nov of 01, and the SP500 in Oct of 02.

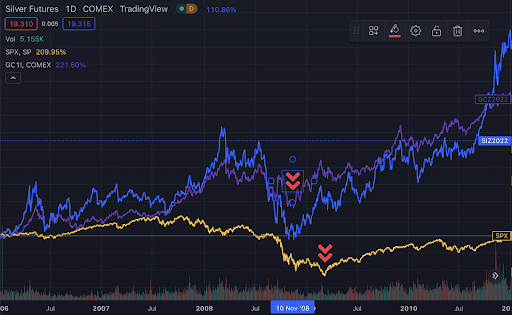
In the GFC, gold and silver found their bottom in Nov of 08 while the SP500 bottomed in Mar of 09.
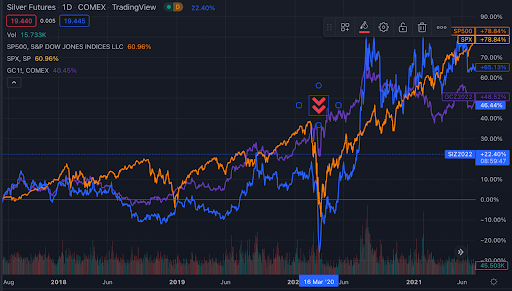
In the 2020 crash, gold, silver, and the SP500 bottomed together in mid-March. The Fed announced a monetary bazooka around this time. I don’t consider this a “real” bear market, but that's for you to decide.
Note: I didn’t include the 70’s and 80’s although I understand the inflationary nature of the period makes it arguably the best comp. There were some "interesting" developments in the silver market (which influenced gold) during that period. Could be more noise than signal.
My conclusion: there is a “truism” by some on FinTwit that silver and gold can't do well while stock markets implode. History suggests it's more nuanced. Perhaps everything bottoms together like 2020 this time - but if you believe this is the ONLY outcome, dig deeper.
Lastly, let’s touch on the “gold and silver aren’t inflation hedges. we’ve had inflation and they’re going down!” argument:
Note: focusing on gold for more signal over noise due to the silver oddities in the late 70’s and early 80’s.
Note: focusing on gold for more signal over noise due to the silver oddities in the late 70’s and early 80’s.
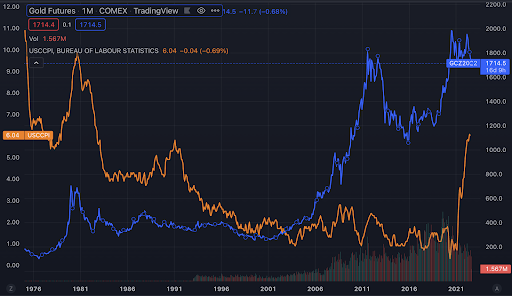
10 people can look at a chart and draw 12 different conclusions, but I read this as gold sniffs out inflation well before it occurs and prices it in FAST.
It is the ultimate "buy the rumor sell the news" market. IMO, what happens here is the “smart money/time travelers” in this space hedge inflation with gold and silver by front running it, and then sell into the hype to buy assets that have continued falling.
It's very possible we see more downside in the coming months.
But, I believe this bear market ends with massive stimulus measures and structurally higher inflation. Thus, I'm starting to skate to where I believe the puck is going. I may be wrong. Do your own DD.
GLTA!
But, I believe this bear market ends with massive stimulus measures and structurally higher inflation. Thus, I'm starting to skate to where I believe the puck is going. I may be wrong. Do your own DD.
GLTA!
P.S. if anyone is interested in the #silver thesis, there's a space on this today hosted by @rhemrajani9.
://twitter.com/rhemrajani9/status/1569469471269752833?s=20&t=FDITpkTYI5jrjVfH9yNKRw
://twitter.com/rhemrajani9/status/1569469471269752833?s=20&t=FDITpkTYI5jrjVfH9yNKRw
• • •
Missing some Tweet in this thread? You can try to
force a refresh