The NSW epi report for the week ending 10 Sept is now out. Note that this is the week ending just before they switched from daily to weekly reporting, so nothing new on that front. #Covid19Aus#Covid19NSW
You can find the full report here... health.nsw.gov.au/Infectious/cov…
Cases are down another 29% this week. Excellent.
While PCR testing is down again (-15%), so is positivity (at 7% this week). Good.
Cases are down in all age groups, ranging from -24% to -34%. And the biggest fall was in the 60+ age group. Excellent.
This is a new graph, showing cumulative infection rates by age band since 1 Jan 2022.
The over 50s clearly much lower than other age bands. The 0-9s also lower, which may be partly real but I also suspect (no proof) that this age group may be tested less than older ages.
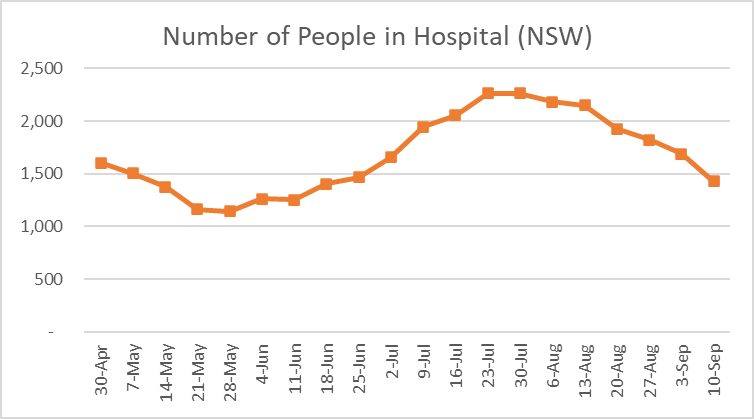
The number of people in hospital fell by 15% this week. Awesome. I've been waiting for a double digit reduction.
People admitted to hospital this week fell by a whopping 30%. Fantastic.
By age band, reductions in hospitalisations were mainly in the 60-79 and 80-89 age bands. Brilliant.
122 deaths this week. Similar numbers to the previous 2 weeks. Never good.
The proportion of deaths in aged care residents up a little after a low week last week.
Variants of concern are interesting. NSW shows two things. This first graph shows a breakdown by variant of people in hospital or those arriving from overseas (so a biased sample).
It shows an increase in BA.2.75 which some people are saying may cause the next wave.
This second graph shows a broader picture, being the results of all tests from one of the large pathology providers. It shows the proportion with s-gene target failure (i.e. NOT any of the BA.2. strains). It shows no worrying trend. So hopefully the previous graph ....
.... is just an anomaly due to the biased sample and is not a more widespread issue.
The end. Any questions?
• • •
Missing some Tweet in this thread? You can try to
force a refresh
Only a few highlights this week as trajectories haven't changed, and I'm a bit fried after the excess deaths stuff this week:
- cases are down 21% and all age groups moving similarly; good
- PCR testing is down, but positivity rate is also down; good
- hospital admissions down 15%; excellent. The biggest % fall we've seen in a long time
- people in hospital down 6%; good. Hopefully this % will be even bigger next week as the lower admissions flow through
- 126 deaths; never good. But the lowest number in the seven weeks
Our latest estimates of excess deaths are out, covering all cause mortality to the end of May 2022, plus COVID-19 only mortality for Jun-Aug. #COVID19Aus#excessdeaths
TLDR: +8,500 excess deaths in 5 months to May (12%) actuaries.digital/2022/08/31/cov…
Note our excess deaths are measured relative to pre-pandemic expectations of mortality.
Includes allowance for continuation of mortality improvement/decline for each cause of death.
Allows for changes in the size and age composition of the population.
Another month of huge excess deaths in May. Only one week in 2022 to date has been within our 95% confidence interval
Nerd alert: I am massively happy to see age standardisation used in the methodology to estimate excess deaths.
This is a major flaw in the ABS commentary on its Provisional Mortality Statistics. Its "baseline" makes no allowance for population changes.
[I'm on an Actuaries Institute working group that has a specific focus on the mortality impacts of the pandemic. You can find out latest here.]
Our latest on excess deaths in Australia, covering all cause mortality to 30 April, plus excess from COVID-19 only to 31 July. #Covid19Aus
TLDR: 13% excess (+6,800 deaths) Jan-Apr 22.
8% excess (+3,500 deaths) from Covid only May-July.
Covid third leading cause of death in 2022.
Total excess mortality for the month of April 2022 estimated at 9% (+1,200 deaths).
More than half is due to doctor-certified COVID-19 deaths. Other unspecified causes and coroner-referred deaths (which include some COVID-19 deaths) also made a significant contribution.
With January at 20% excess mortality, February at 15% and March at 7%, this takes total excess mortality for the first four months of 2022 to 13% (+6,800 deaths).