
Last week, Census released 2021 data giving us our first look at the spatial distribution of the transition to working from home. A tale of two Americas emerges. Those who could adjust to work from home, and those who could not.
A quick deep viz dive into the data...🧵
#wfh
A quick deep viz dive into the data...🧵
#wfh

We see major #disparities in the share of the population that worked from home by race/ethnicity with White and Asian Americans able to WFH at much higher share than Black and Hispanic Americans regardless of city. Here a look at how WFH share varied across cities over 500k.
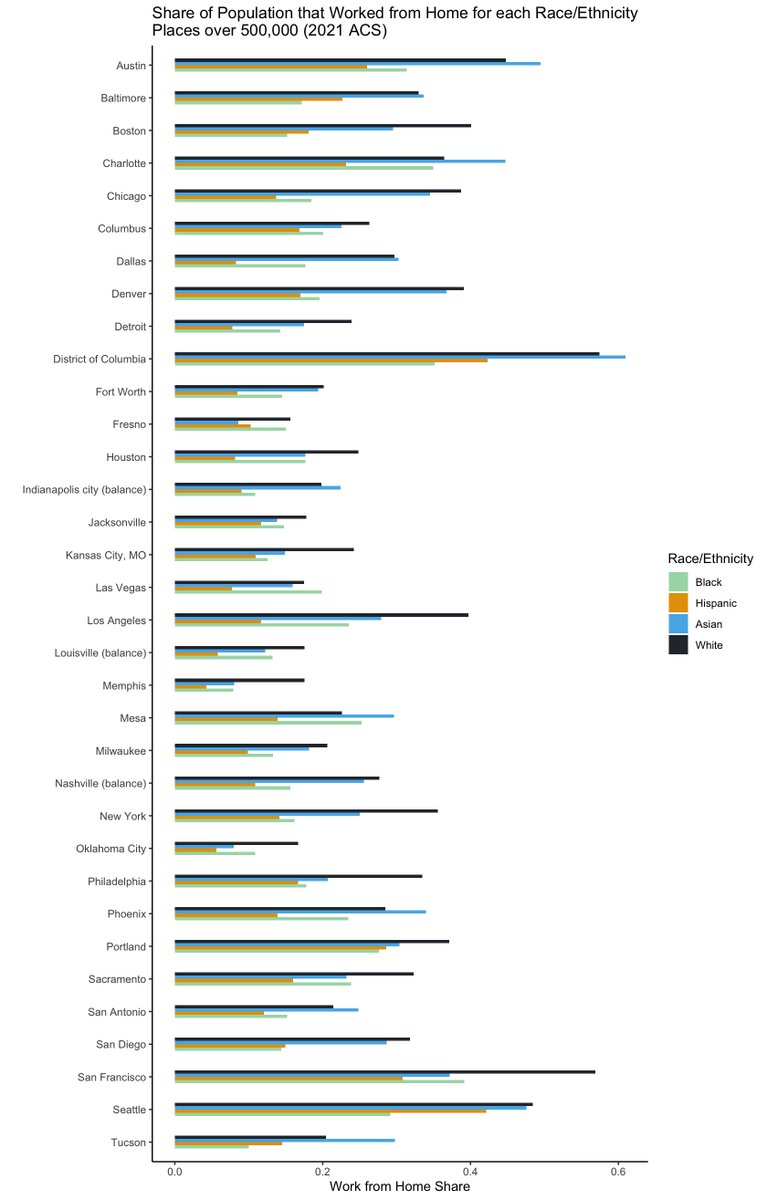
Some cities - DC and SF - had relatively high share of population WFH and also were relatively equitable. Other cities, like LA, Boston, and New York exhibit large disparities by race/ethnicity. This begs the question if income or accommodations are factors. Let's look at both.
Census data include median income by commuting mode. We can see that uniformly, the population that worked from home earned more than the population at large for all cities featured. The #incomedisparity is particularly large for "tech" cities like SF, San Jose, and Seattle.🤔

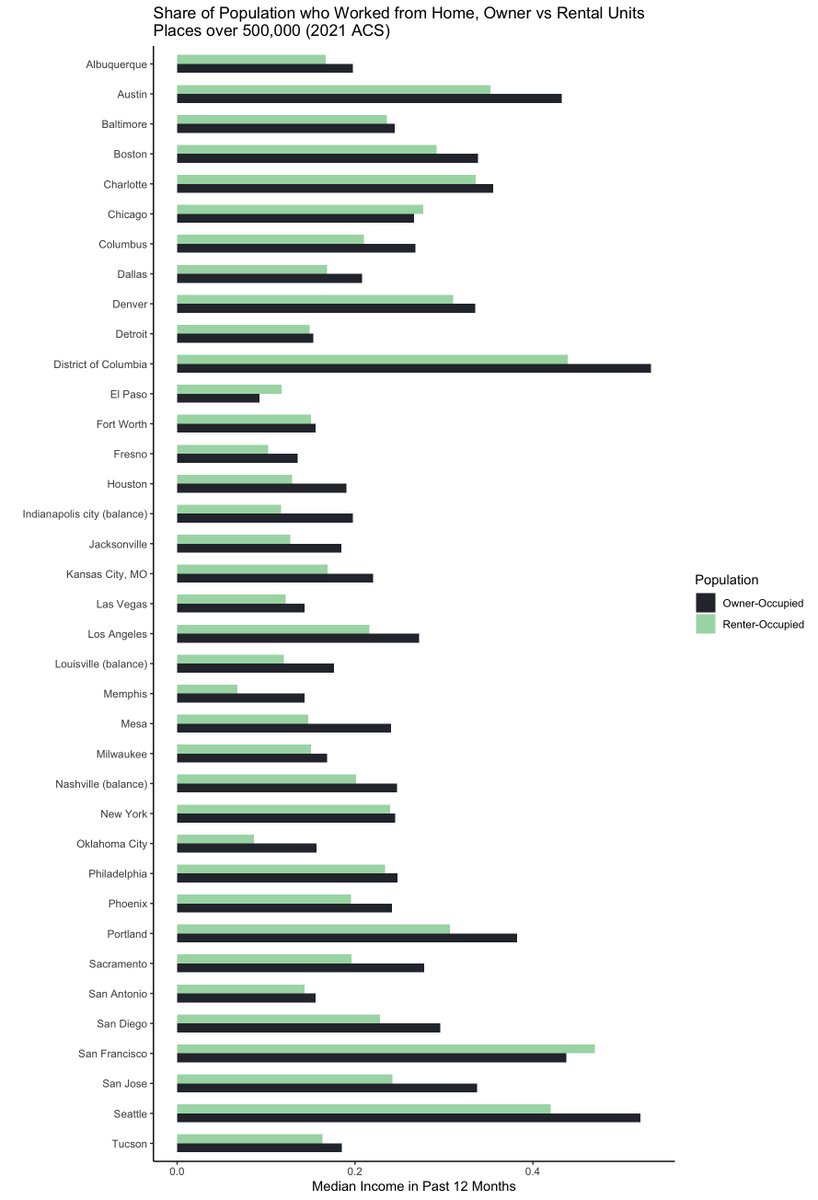
Another thing I wondered about is does #housing ownership matter here; namely, renter vs owner occupied. We do see differences in WFH but not as large as I thought we'd see. I have some thoughts about this, but not clear enough to concisely capture on here.
#urbanplanning
#urbanplanning
Did the ability to work from home and adapt to the pandemic both for quality of life and prevention vary by race/ethnicity and income? Yes. We knew this before from nationally representative data, but this is the first look into the spatial variation across the US.
And vary it did! Not only did the overall work from home share vary even among similar urban areas, but so did the race/ethnicity and income disparities. It's hard to tell why from this descriptive analysis. It could be policies, demographics, covid waves, housing stock...
But not knowing why does not reduce the importance of understanding that WFH ability varies considerably across the population.
And with these WFH changes likely to be sticky into the future, the dichotomy of those who can and can't WFH will matter for myriad reasons.
And with these WFH changes likely to be sticky into the future, the dichotomy of those who can and can't WFH will matter for myriad reasons.
Data are from the Census American Community Survey 2021 one year dataset. Margins of error are reasonably small using the "place" geography. PUMA resolution is finer but some MOEs grow to unstable.
TY to @kyle_e_walker for the tidycensus R package. TMAP and GGPLOT2 used for viz.
TY to @kyle_e_walker for the tidycensus R package. TMAP and GGPLOT2 used for viz.
FYI @yfreemark @DavidZipper @mslaurabliss @ShiraOvide @schmangee @racheluranga @taydolven @mikelaris @veronica_penney others?
• • •
Missing some Tweet in this thread? You can try to
force a refresh


