
Want to know more about the Volume Profile?
Grab a cup of coffee or a few minutes to read unhindered and I'll walk you through how we use the information from the Volume Profile
Grab a cup of coffee or a few minutes to read unhindered and I'll walk you through how we use the information from the Volume Profile

Q) What is the Volume Profile?
A) An advanced version of the MarketProfile .
Q) What is the MarketProfile
A) First read this and then come back here - vtrender.com/what-is-the-ma…
A) An advanced version of the MarketProfile .
Q) What is the MarketProfile
A) First read this and then come back here - vtrender.com/what-is-the-ma…
The early MarketProfile traders never had the benefit of Volume
The exchanges introduced Volume to markets only in 1992
To get around they arrived at a simple formula
Price X Time = Volume at Price
Simply put, the more time price spent at a price , the more volume was created
The exchanges introduced Volume to markets only in 1992
To get around they arrived at a simple formula
Price X Time = Volume at Price
Simply put, the more time price spent at a price , the more volume was created
Thus was born the concept of Volume Profile or Volume at Price.
It was to look at prices as a histogram next to the price charts ( not below price bars).
Post 1992, With real time Volume now coming to markets, traders became smarter.
Here is an example of Volume Profile Chart.
It was to look at prices as a histogram next to the price charts ( not below price bars).
Post 1992, With real time Volume now coming to markets, traders became smarter.
Here is an example of Volume Profile Chart.
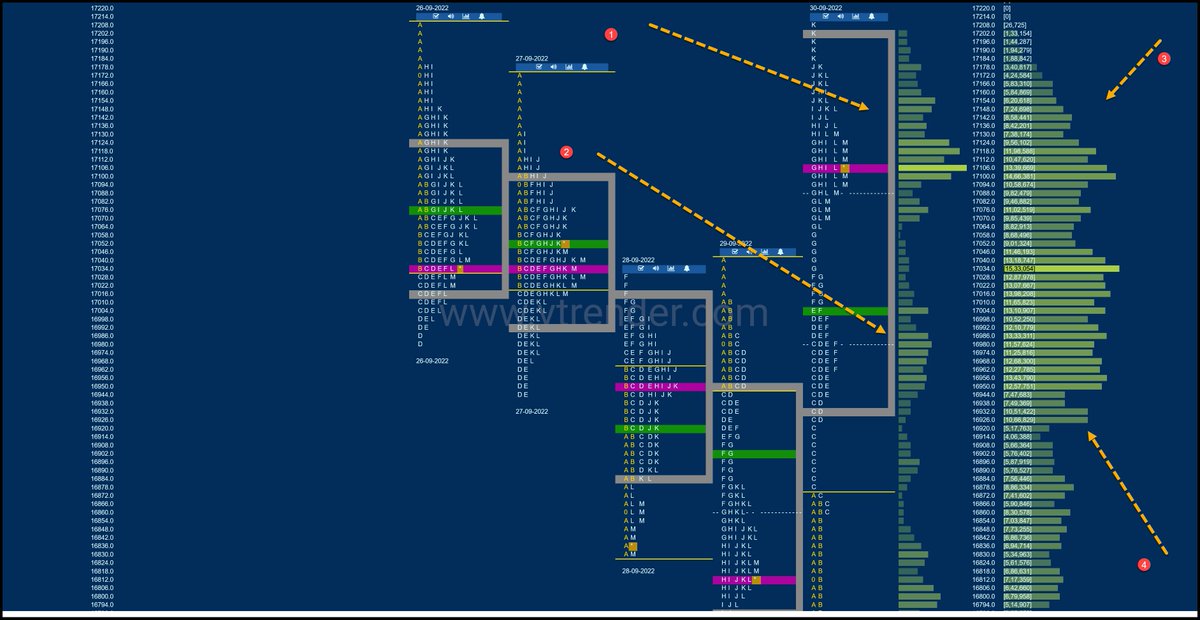
In the example above you can see a Volume Histogram in Green right next to the Price Chart.
You can also see the Volume Histogram for a range of prices as seen to the extreme right of the chart.
You can also see the Volume Histogram for a range of prices as seen to the extreme right of the chart.
@Vtrender, We plot Volume Profile on the MarketProfile charts, but you can also plot it on any bar chart or any candle chart or anything else which can give you Volume.
You have always been used to seeing Volume below price bars
Volume Profile turns the concept 180* around and shows you Volume for every price traded.
This is far more useful than looking at Volume traded below the bar at the end of 5 minutes, 30 mins, 1 day, 1 week or 1 month.
Volume Profile turns the concept 180* around and shows you Volume for every price traded.
This is far more useful than looking at Volume traded below the bar at the end of 5 minutes, 30 mins, 1 day, 1 week or 1 month.
I'll explain
But before that let me answer your pressing question
where do you get these Volume Profile charts and for free?
Go to the charts section at vtrender.com for Free Volume Profile charts of NF, BNF, options of Nifty, banknifty, finnifty & many more
But before that let me answer your pressing question
where do you get these Volume Profile charts and for free?
Go to the charts section at vtrender.com for Free Volume Profile charts of NF, BNF, options of Nifty, banknifty, finnifty & many more

How is Volume Profile useful?
Say the Nifty moves 300 points in a day
You look at the Volume of the day below price & obviously you will find it high as range of move is high
But you do not know where in the 300 points of move the Volume came
Volume Profile shows exactly that
Say the Nifty moves 300 points in a day
You look at the Volume of the day below price & obviously you will find it high as range of move is high
But you do not know where in the 300 points of move the Volume came
Volume Profile shows exactly that
Now the next question you may have.
How do I read it ?
What can it show me which other charts do not?
Volume Profile shows you actual trades taken and positions of the market Participants for a range of prices.
How do I read it ?
What can it show me which other charts do not?
Volume Profile shows you actual trades taken and positions of the market Participants for a range of prices.
It can show you where they entered , where they like to trade and where they do not
The areas where the market likes to trade are associated with a thicker Volume Histogram and shows that the market likes to trade here
These are called HVN's short for high Volume Nodes
The areas where the market likes to trade are associated with a thicker Volume Histogram and shows that the market likes to trade here
These are called HVN's short for high Volume Nodes
The areas where the market does not like to trade are called LVN's short for Low Volume Nodes
HVN's and LVN's are the building blocks of a Volume Profile chart.
Check the example below
HVN's and LVN's are the building blocks of a Volume Profile chart.
Check the example below

You can plot a Volume Histogram for option charts also and check the LVN's and HVN's
Here is 38800 CE from Friday's trade
Check the LVN at 200 and the HVN at 430
Here is 38800 CE from Friday's trade
Check the LVN at 200 and the HVN at 430

I have explained how to use the Option charts at a previous thread here -
https://twitter.com/Am_Shai/status/1459434176155820035
There are many things you can get from a Volume Profile chart
I'll give you the two low hanging fruit which all of you following me should know and trade freely with.
A) The HVN's attract price
B) The LVN's reject price
I'll give you the two low hanging fruit which all of you following me should know and trade freely with.
A) The HVN's attract price
B) The LVN's reject price
To put it simply, use HVN's for price targets
Use LVN's for inputting a stop loss
If you can only follow these 2 basic rules of the Volume Profile, you will eliminate 50% of the mistakes which other price traders do.
Use LVN's for inputting a stop loss
If you can only follow these 2 basic rules of the Volume Profile, you will eliminate 50% of the mistakes which other price traders do.
You can use Volume Profile for the same day as I have shown or you can use the big Volume histogram for a range of prices.
The same concepts are to be used .
The same concepts are to be used .
There are many more concepts in the Volume Profile like a Value area, acceptance, rejection , POC etc .
Please feel free to look up our Forum section for a daily post we do using this information
You can check the previous day at - vtrender.com/market-profile…
Please feel free to look up our Forum section for a daily post we do using this information
You can check the previous day at - vtrender.com/market-profile…
We also do a free write up on the weekly Profile and the Monthly profile in the Forum section and these are updated religiously without fail.
Follow @Vtrender for a real time update of these posts.
Follow @Vtrender for a real time update of these posts.
A more advanced version of the Volume Profile is called the Orderflow.
The orderflow looks inside the price bar ( instead of next to the price bar) and tells you real time what is moving prices
The orderflow looks inside the price bar ( instead of next to the price bar) and tells you real time what is moving prices
We track the Orderflow live in the markets in our mentoring room with traders at -
vtrender.com/trading-room/
vtrender.com/trading-room/
I like to tweet information on markets which is not commonly available outside.
You can check my previous threads here -
You can check my previous threads here -
https://twitter.com/Am_Shai/status/1535858817690243072?s=20&t=yWuRfbRskmcrYm4u_3LeQg
If you have liked this thread on the #VolumeProfile, please help a fellow trader in your groups by sharing this info with them.
The more help you provide to a fellow trader, the more you would get back from the markets.
So do RT.
The more help you provide to a fellow trader, the more you would get back from the markets.
So do RT.
• • •
Missing some Tweet in this thread? You can try to
force a refresh


