Q: Which of these would produce biggest the blood sugar response?
(i.e., biggest change in glucose concentration)
Answers below (1/8) 🧵 #glucose #health #metabolism
(i.e., biggest change in glucose concentration)
Answers below (1/8) 🧵 #glucose #health #metabolism
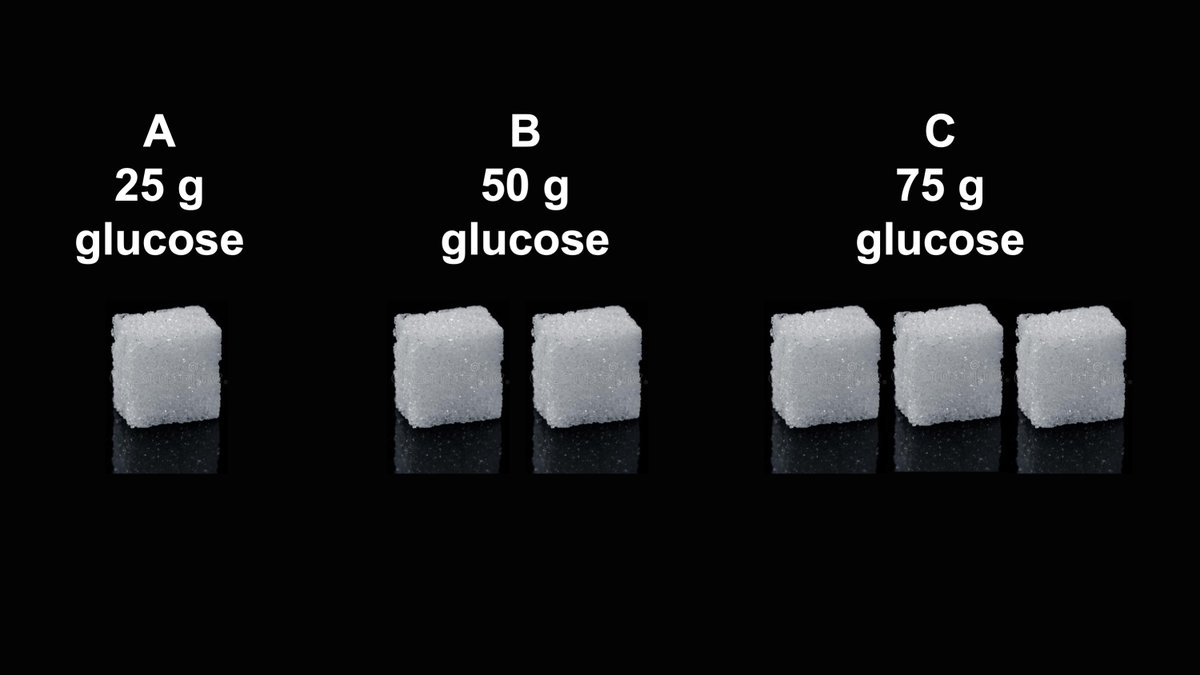
Have a guess here before reading on to find out if you are right... (2/8)
A: There is no meaningful difference (at least in healthy people) - data from: pubmed.ncbi.nlm.nih.gov/28684634/
How can 75 g glucose (3 times more) not increase glucose more than 25 g?
(3/8)
How can 75 g glucose (3 times more) not increase glucose more than 25 g?
(3/8)

The more glucose ingested, the higher the rate of appearance of glucose into the blood.
So something must be happening to offset this.
It could be less glucose appearing from stored carbs the liver (& kidneys),
or more glucose disappearing into tissues (e.g., muscle)...
(4/8)
So something must be happening to offset this.
It could be less glucose appearing from stored carbs the liver (& kidneys),
or more glucose disappearing into tissues (e.g., muscle)...
(4/8)

There were no meaningful differences in endogenous glucose production.
(glucose appearing mainly from the liver)
(5/8)
(glucose appearing mainly from the liver)
(5/8)

But insulin showed a clear dose-response to increased glucose intake, so why was liver glucose output largely similar?
Liver glucose output is maximally suppressed at relatively low concentrations of insulin.
What about rates of disappearance (mainly into muscle)?
(6/8)
Liver glucose output is maximally suppressed at relatively low concentrations of insulin.
What about rates of disappearance (mainly into muscle)?
(6/8)

Increased disappearance rates (mainly into muscle) explain how 75 g glucose can produce a similar blood glucose response to 25 g of glucose by offsetting appearance rate.
Because rates of disappearance show almost a linear dose-response to insulin in a physiological range
(7/8)
Because rates of disappearance show almost a linear dose-response to insulin in a physiological range
(7/8)

In summary:
Circulating glucose concentrations do not necessarily reflect the amount of carbs that have just been eaten.
Nor do they necessarily reflect the rate of carbohydrate digestion-absorption into the circulation.
Concentrations reflect the net balance of kinetics
(8/8)
Circulating glucose concentrations do not necessarily reflect the amount of carbs that have just been eaten.
Nor do they necessarily reflect the rate of carbohydrate digestion-absorption into the circulation.
Concentrations reflect the net balance of kinetics
(8/8)
• • •
Missing some Tweet in this thread? You can try to
force a refresh