[#ExtremeWeather #ClimateChangeNow DATA ANOMALY THREAD – Central & North America]
In this thread I release five sets of data which appear to show atmospheric geo-engineering over North America at unprecedented scale, seemingly for the purpose of keeping hurricanes away.
In this thread I release five sets of data which appear to show atmospheric geo-engineering over North America at unprecedented scale, seemingly for the purpose of keeping hurricanes away.

During observations of #Invest91L #HurricaneJulia & #TSKarl in Central America there was an issue elephant sized mystery in the room – a tangential one, namely what is going on with the Arctic?
The constant impact of a the endless series of arctic blasts on forecasts came particularly obvious when hurricanes in both the Atlantic and Pacific were shown in a forecast moving south in model forecasts.
https://twitter.com/althecat/status/1578842257910034434?s=20&t=qFFD-PpHjkIr_Vhn4-MuiQ
The cause ongoing significant atmospheric temperature anomaly over the Arctic & North America, which is having a material impact on Central American weather.
https://twitter.com/althecat/status/1579807362420191233?s=20&t=LENYodUWE5qYR1Ps49wnMw
The arctic temperature component of this has been noted widely (see quoted tweet). But the impact on atmospheric water movement has not.
https://twitter.com/EliotJacobson/status/1580196662013632514?s=20&t=eOanmsC7qqszE3hi0qIC1w
The impact of the event in precipitable water data & satellite imagery is very obvious. A seemingly endless series of Arctic blasts of peculiarly warm air coming south over North America is keeping the continent free of moisture.
This is also preventing hurricane’s from approaching the southern United States, and significantly reducing atmospheric water over the United States as you can see.

The anomaly isalso easily observable on the ground.
1.Clear skies over Western US
2.Unseasonable warmness, especially in Alaska, the Arctic, Canada and Western US particularly – the arctic blasts are mostly moving east.
1.Clear skies over Western US
2.Unseasonable warmness, especially in Alaska, the Arctic, Canada and Western US particularly – the arctic blasts are mostly moving east.
https://twitter.com/althecat/status/1580193778740396033?s=20&t=eOanmsC7qqszE3hi0qIC1w
An explanation of the data - its context and implications will follow in a second thread.
For now I will describe the data collected so far: [Google Drive repository to download data >> drive.google.com/drive/folders/… ]
For now I will describe the data collected so far: [Google Drive repository to download data >> drive.google.com/drive/folders/… ]
The data comes from publicly accessible sources:
-long range weather simulation model data from @NOAA’s GEFS Model via @weathermodels_ .
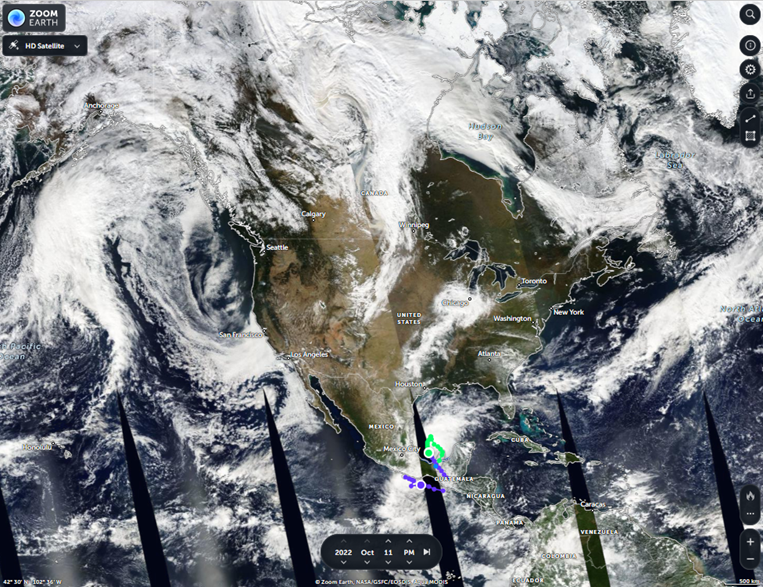
-Satellite imagery data from @Zoom_Earth and @NASA Worldview
-long range weather simulation model data from @NOAA’s GEFS Model via @weathermodels_ .
-Satellite imagery data from @Zoom_Earth and @NASA Worldview


The data shows a stationary source for the anomaly in two locations on the West and East Coast of Canada. Both locations are show a persistent atmospheric height and temperature anomaly that does not move in Zero Hour forecast data (i.e. current weather).
https://twitter.com/althecat/status/1580971560453935104?s=20&t=eOanmsC7qqszE3hi0qIC1w
Primary data was collected on the 13th and 14th of October using @weathermodels_ and comes from the GEFS (ensemble model) there are five time series in the Google Drive repository. >> drive.google.com/drive/folders/…
1.Series 1: Arctic 850hpa height anomaly 10-12 October

2.Series 2: North America 850hpa Temperature Anomaly data 11-14 October

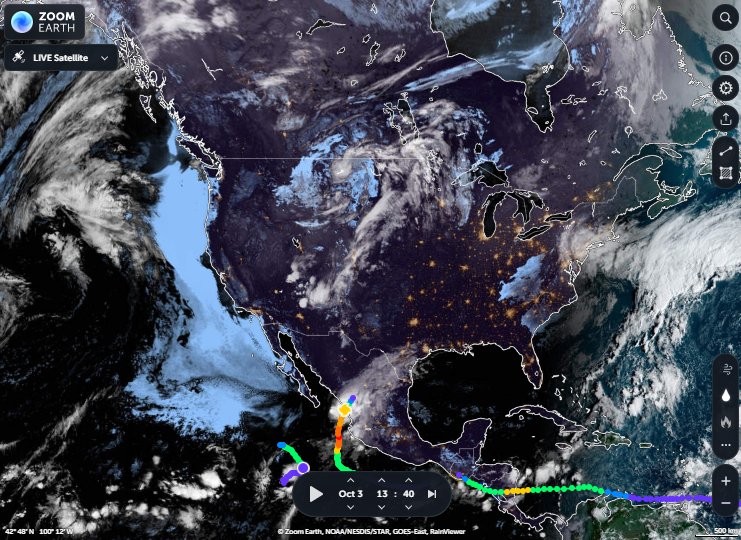
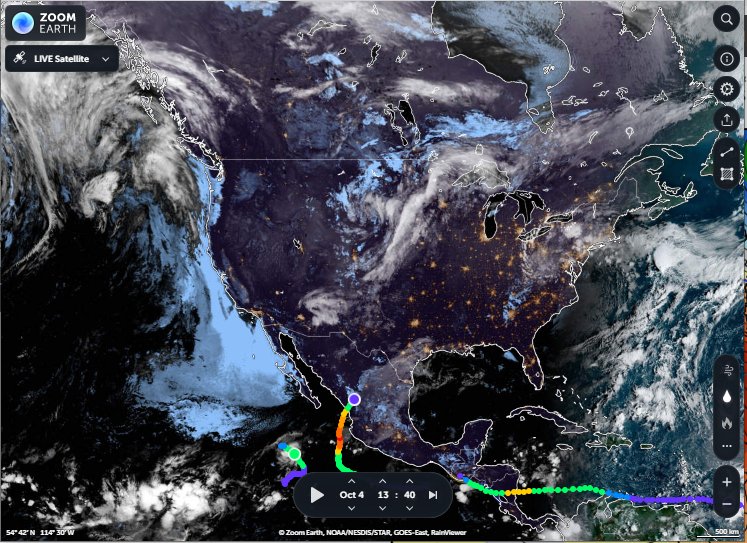
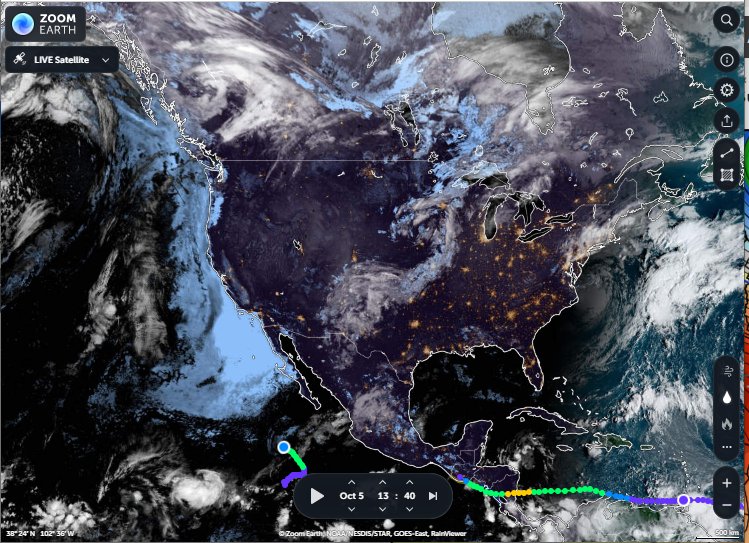
3.Series 3 : North America night time satellite imagery sequences from late Sept till today

4.Series 4. Daytime satellite imagery sequences from late Sept till today

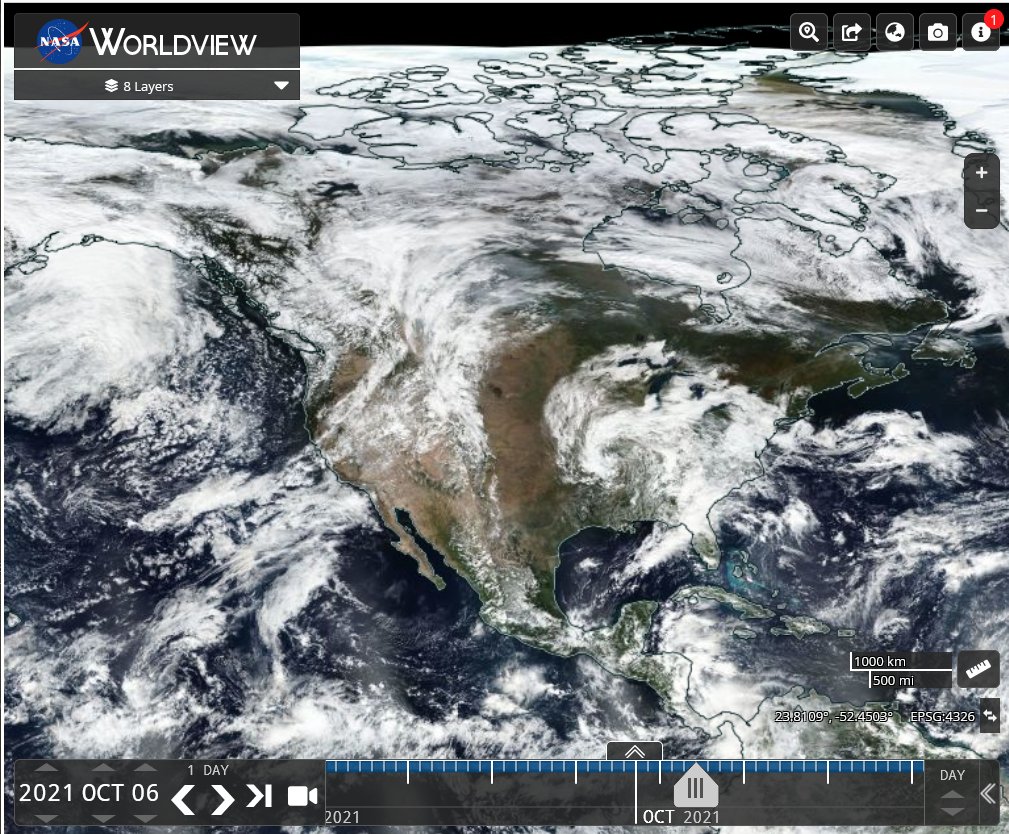
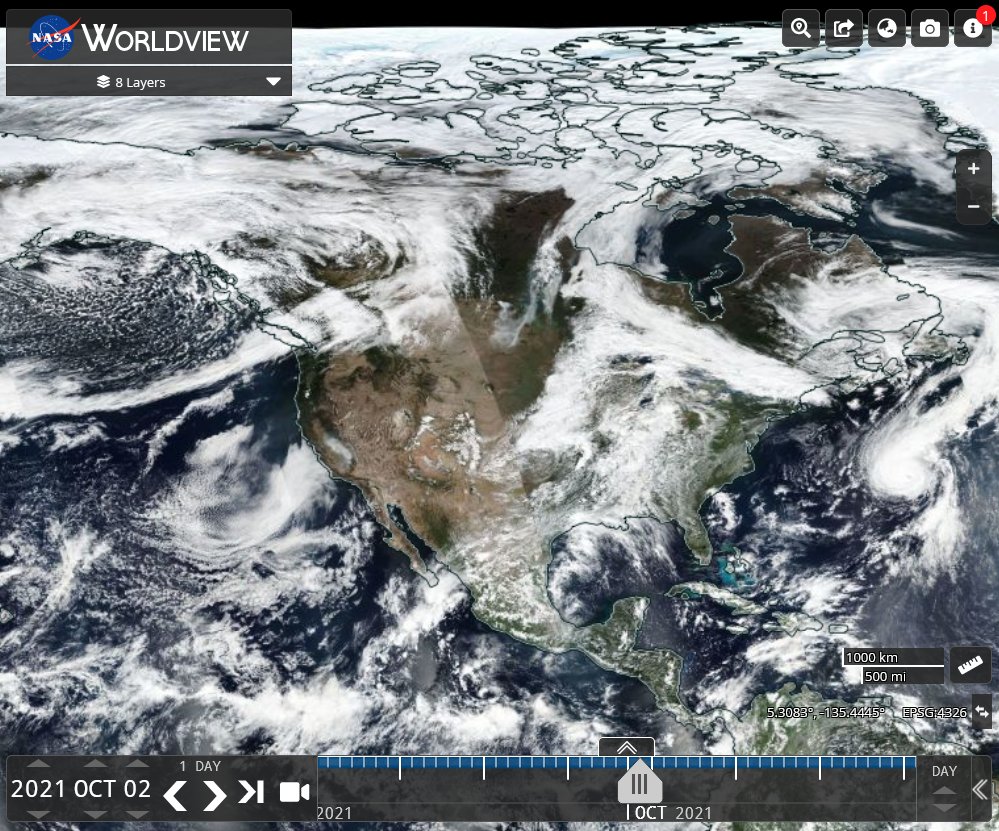
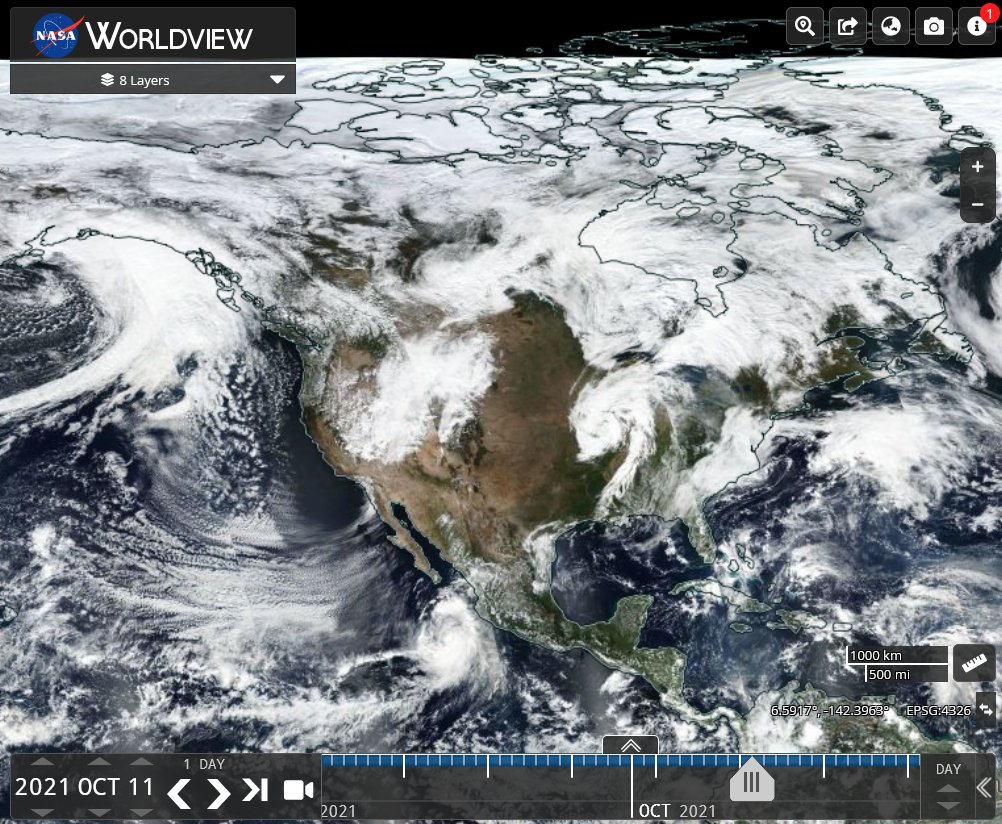
5.Series 5. A NASA North America satellite image sequence from the same period in 2021
The overlapping temperature and atmospheric height data shows a repetitive pattern over a five day period. Satellite imagery event appears to have started earlier, but after September 26th. The data suggests it may have begun after #HurricaneIan & its remnants.

Normal weather data is natural, fluid and stochastic i.e.“having a random probability distribution.”
This weather data is not.
This weather data is not.

North America’s current weather appears to be being driven by this anomaly.
My conclusion is this cannot be natural & that therefore it is human made. I realise this is a serious claim to make, hence releasing my data for review.
My conclusion is this cannot be natural & that therefore it is human made. I realise this is a serious claim to make, hence releasing my data for review.
I will post sufficient data here in this to make the central point clearly. The data is repetitive – which is the reason for this thread & data release.
Extreme weather that doesn’t move - that is exactly the same every day for 5 days & possibly longer - is anomalous. Very.
Extreme weather that doesn’t move - that is exactly the same every day for 5 days & possibly longer - is anomalous. Very.
To view/download the complete data visit the repository here >> drive.google.com/drive/folders/…
DATA Series 1 Subthread: 11 Zero Hour simulation data slides of 850hpa height anomaly data for North America 10-12 Oct 1/5
1. 10th October 2/5
1. 10th October 2/5


2. 11th October 3/5


3. 12th October 4/5


DATA Series 2 Subthread: 11 Zero Hour simulation data slides of 850hpa temperature data for North America 10-12 Oct
1/4 tweets
1. 11th October
1/4 tweets
1. 11th October


2. 12th October 3/4


3. 13th October 4/5


14th October 5/5

DATA Series 3 Subthread: North America Nightime satellite imagery
1. Sept 30
2. October 2
3. October 7
4. October 11
[Could not get Sept 30th night image]
1. Sept 30
2. October 2
3. October 7
4. October 11
[Could not get Sept 30th night image]


DATA Series 4 Subthread: North America Daytime satellite imagery
1. October 1
2. October 2
3. October 7
4. October 11
1. October 1
2. October 2
3. October 7
4. October 11


DATA Series 5 Subthread: ¬ Comparative 2021 Satellite imagery
1. October 1
2. October 2
3. October 7
4. October 11
1. October 1
2. October 2
3. October 7
4. October 11


I will post a thread tomorrow discussing implications of what appears to be a public reveal of climate control technology. Its not necessarily a bad thing to have, and it has been an open secret for some time.
But now transparency is needed.
/ENDS
@Threadreaderapp runroll
But now transparency is needed.
/ENDS
@Threadreaderapp runroll
• • •
Missing some Tweet in this thread? You can try to
force a refresh