
🧵 #FOMC Trade Thread 🧵
How To Trade #FOMC $SPY $SPX
🚨THIS STRATEGY IS 100% ACCURATE PAST 19 FOMC’S🚨
JUST IN TIME FOR TOMORROWS BIG DAY!
♻️RETWEET THIS♻️
How To Trade #FOMC $SPY $SPX
🚨THIS STRATEGY IS 100% ACCURATE PAST 19 FOMC’S🚨
JUST IN TIME FOR TOMORROWS BIG DAY!
♻️RETWEET THIS♻️
This strategy has made 60-140+ POINT MOVES in $SPX which equates to around $5-$15 Moves in $SPY ITSELF! 🚀
There is 1 way on how to trade this strategy and to also state #FOMC is very risky to trade with #SPY #SPX #Options due to the #volatility
HERE IS HOW TO TRADE #FOMC 👀: You FADE the INITIAL REACTION at 2PM EST once the Rates are given out and you PLAY the opposite when Powell Speaks at 2:30PM EST.
Also, of course wait for price action to confirm. ✅
Also, of course wait for price action to confirm. ✅
HERE IS HOW TO TRADE #FOMC 👀: You FADE the INITIAL REACTION at 2PM EST once the Rates are given out and you PLAY the opposite when Powell Speaks at 2:30PM EST.
Also, wait for price action to confirm ✅
Also, wait for price action to confirm ✅
💵 ITS THAT SIMPLE. 💵
For example: If initially the market falls at 2PM you would go long at 2:25-2:35 once he starts to speak and this can be helped by Candlesticks & Price Action! 📈
For example: If initially the market falls at 2PM you would go long at 2:25-2:35 once he starts to speak and this can be helped by Candlesticks & Price Action! 📈
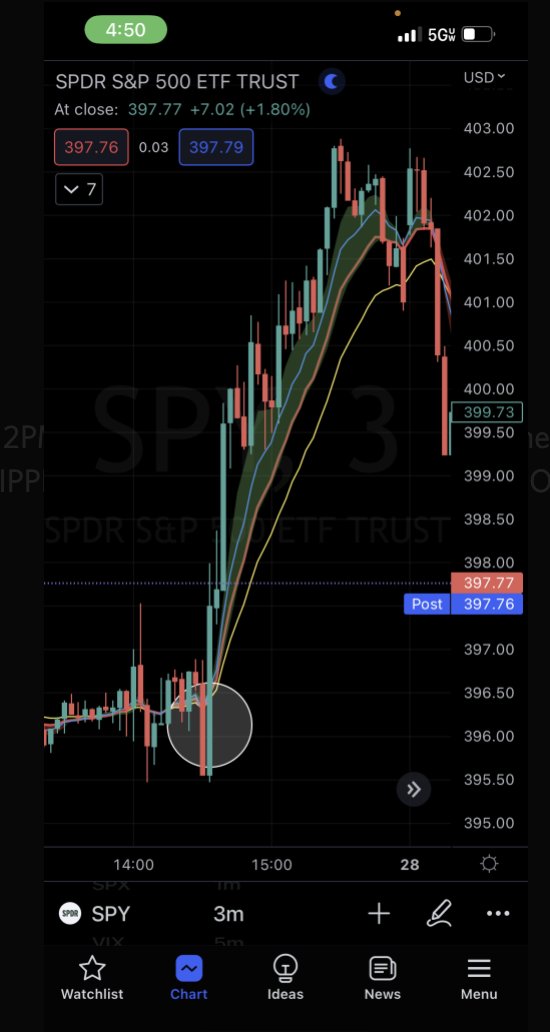
July 26-27 #FOMC Example: 2PM initial reaction you see the red higher wick and falls. Then you see at 2:30 fake out again to downside then RIPPED UP for a $6 POINT MOVE IN 1 HOUR. 🚀📈🤯 
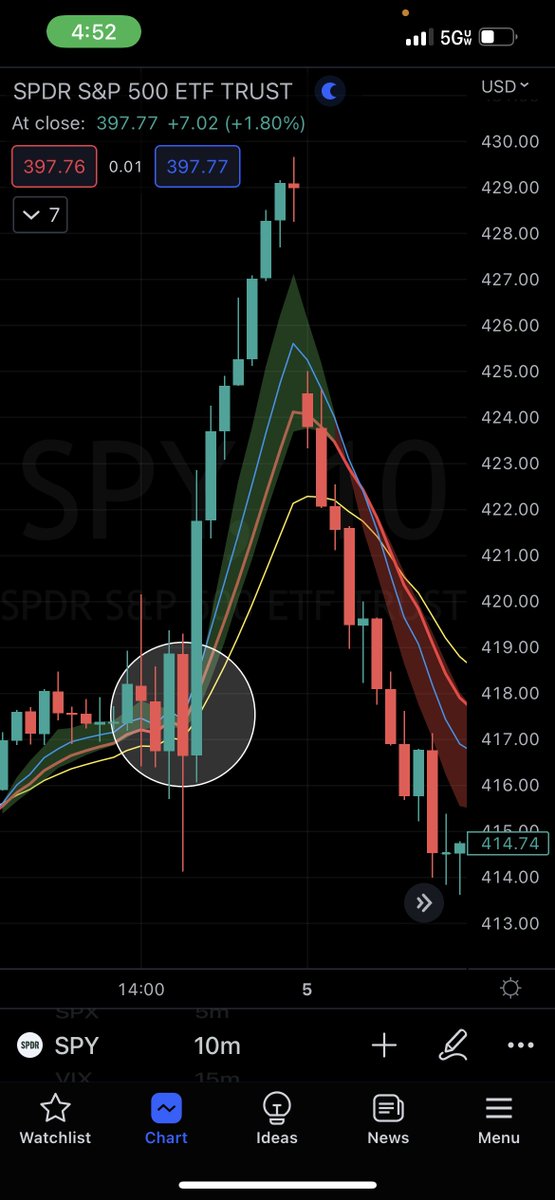
May 3-4 #FOMC Example: 2PM initial reaction red and went lower and started consolidate then the circle shows 2:30 starts to spike after the fake break down for a $14-$15 MOVE to upside in under 1 HOUR! 📈 $SPY
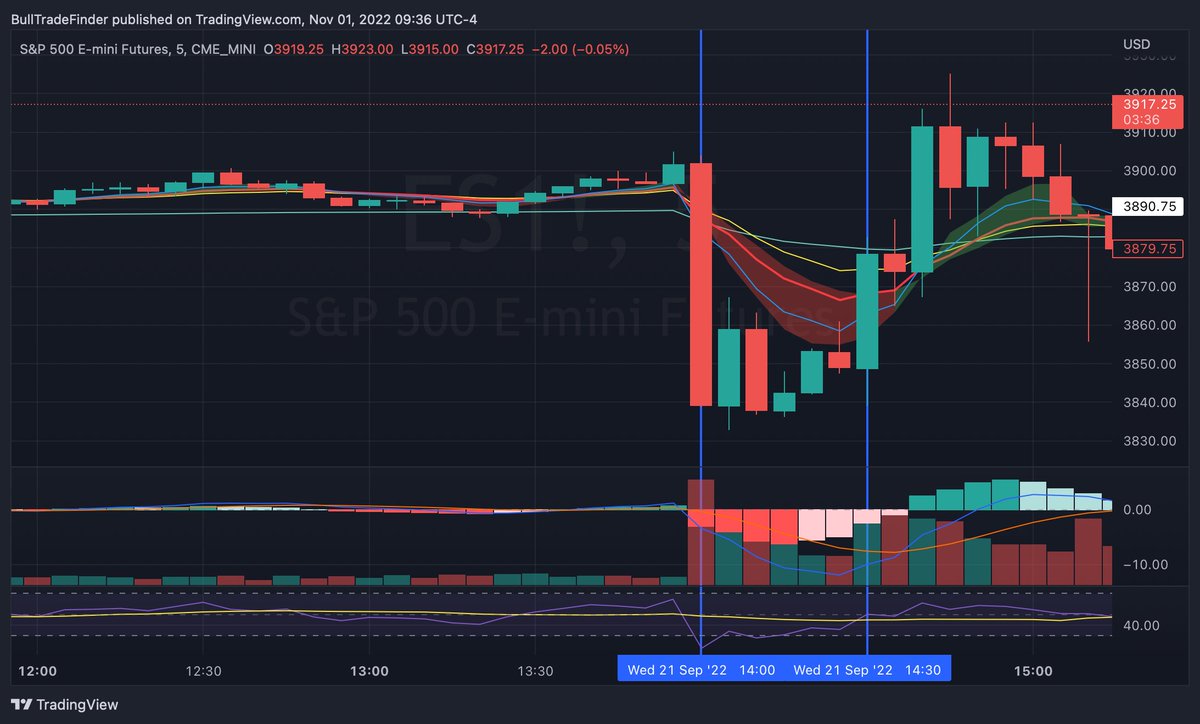
Sep 21 #FOMC $SPY Example.: 2PM Initial reaction big red, chop/consolidate as usual then second blue vertical line isn 2:30 and we ripped from bottom to top 85-95 points in a matter of 1 hour again which for $SPY is $7-$9 MOVE! 🚀
THESE ARE 500-1000%+ $SPY $SPX PLAYS THAT I HAVE BEEN PREACHING FOR OVER 2 YEARS NOW! ⭐️
PLEASE RETWEET, LIKE, FOLLOW AND PUT ON THOSE NOTIFICATIONS FOR MORE THREADS AND ALERTS LIKE THESE! 🔔
We are OFFERING 30% OFF THE FIRST MONTH USING CODE BTF30 🚨 at bulltradefinder.net
Come trade with a strong and growing community with tons of data and ideas to offer.
Come trade with a strong and growing community with tons of data and ideas to offer.
• • •
Missing some Tweet in this thread? You can try to
force a refresh


