Grab a cup of coffee☕️
Today, we’ll learn one of the simplest valuation models for a publicly traded stock which can also blend in with your financial goals.
I’m talking about the Dividend Discount Model (DDM)
A detailed thread 🧵with HCL Tech as example & bonus giveaway
(1/n)
Today, we’ll learn one of the simplest valuation models for a publicly traded stock which can also blend in with your financial goals.
I’m talking about the Dividend Discount Model (DDM)
A detailed thread 🧵with HCL Tech as example & bonus giveaway
(1/n)

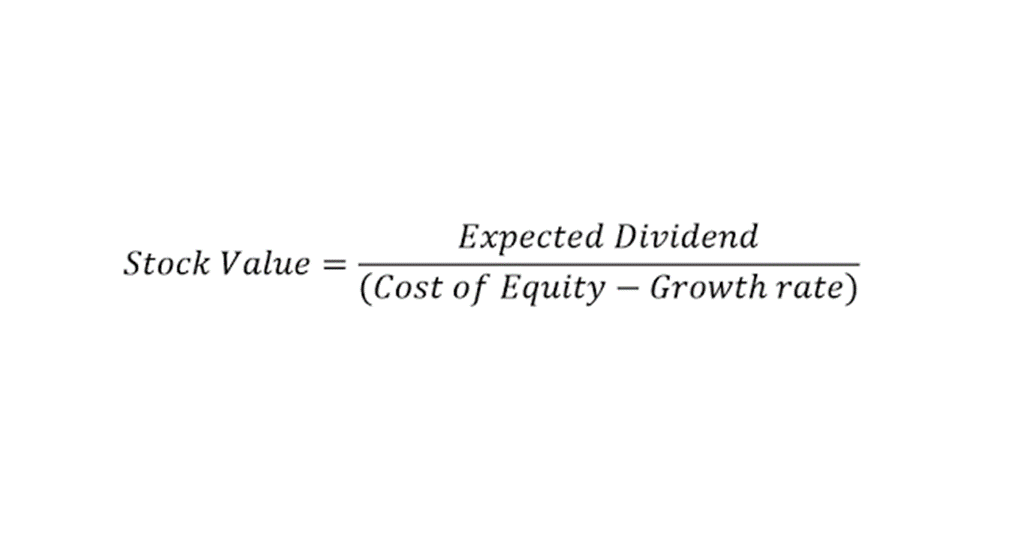
The Dividend Discount Model (DDM) calculates the fair value of a stock based upon the sum of all future dividends discounted to their present value
Stock Price = D/(r-g)
D = est. next year dividend
r = cost of equity capital
g = growth rate of dividends, in perpetuity
(2/n)
Stock Price = D/(r-g)
D = est. next year dividend
r = cost of equity capital
g = growth rate of dividends, in perpetuity
(2/n)
How to simplify the DDM Formula?
“D” – You can use latest FY dividend vs est. of next yr
“r” – You can use 10yr G-sec yield as cost of equity capital or refer to next tweet
• AAA Rated Cos - G-Sec
• AA - G-Sec +1-2%
• A & below - G-Sec + 3-5%
(3/n)
“D” – You can use latest FY dividend vs est. of next yr
“r” – You can use 10yr G-sec yield as cost of equity capital or refer to next tweet
• AAA Rated Cos - G-Sec
• AA - G-Sec +1-2%
• A & below - G-Sec + 3-5%
(3/n)
How to link Financial Goals with Dividend Discount Model?
Use of G-Sec yield for “r” = a variable based on interest rate cycle.
Instead of G-Sec, you can use “Target CAGR” which links it with your financial goals.
Example: If you want 15% CAGR returns, use 15% as “r”
(4/n)
Use of G-Sec yield for “r” = a variable based on interest rate cycle.
Instead of G-Sec, you can use “Target CAGR” which links it with your financial goals.
Example: If you want 15% CAGR returns, use 15% as “r”
(4/n)
“g” – Est. growth rate of future dividends
Most important assumption
A company can have very high dividend CAGR over long term, but much lower in recent past
Ex: #EicherMotors has grown dividends at 26% CAGR since 2005 (Re 0.4 to Rs. 21), but only 13% CAGR in past 6 yrs
(5/n)
Most important assumption
A company can have very high dividend CAGR over long term, but much lower in recent past
Ex: #EicherMotors has grown dividends at 26% CAGR since 2005 (Re 0.4 to Rs. 21), but only 13% CAGR in past 6 yrs
(5/n)

Is it realistic to assume growth rate of dividends into perpetuity?
No, and no company can maintain same growth rate forever!
Markets are forward looking, but most analysts value a stock based on next 1-3 yrs growth, our job is to roughly guesstimate next 3-5 yrs growth
(6/n)
No, and no company can maintain same growth rate forever!
Markets are forward looking, but most analysts value a stock based on next 1-3 yrs growth, our job is to roughly guesstimate next 3-5 yrs growth
(6/n)
How to estimate “g”?
1. Use management guidance on PAT growth & subtract 3-4% for dividend growth rate
2. If no guidance available, study recent 3-5 yrs PAT/dividend growth & subtract 2-3% from it
3. Always err on the side of caution & try to estimate for next 3-5 yrs
(7/n)
1. Use management guidance on PAT growth & subtract 3-4% for dividend growth rate
2. If no guidance available, study recent 3-5 yrs PAT/dividend growth & subtract 2-3% from it
3. Always err on the side of caution & try to estimate for next 3-5 yrs
(7/n)
Bonus Giveaway
I use this template for any high dividend yielding (>2-3%) companies which have a good track record of growing dividend > GDP growth rate
With the 3 DDM inputs, it will reveal the fair value of any stock and the current discount/premium to the fair value
(8/n)
I use this template for any high dividend yielding (>2-3%) companies which have a good track record of growing dividend > GDP growth rate
With the 3 DDM inputs, it will reveal the fair value of any stock and the current discount/premium to the fair value
(8/n)

All my followers who Like & RT the 🧵 can get this Dividend Discount Model (DDM) spreadsheet for your personal use to calculate the fair value of any business
It's pre-populated with my DDM valuation for 5 stocks.
Just drop me a DM & I will share the link by 9pm tomorrow
(9/n)
It's pre-populated with my DDM valuation for 5 stocks.
Just drop me a DM & I will share the link by 9pm tomorrow
(9/n)
Caveats - Do not apply DDM for 👇
1. Cos which have never paid dividend
2. Cos with highly fluctuating dividend payout %
3. Cos with high rate of dividend growth (>20-30%)
Recommended use only for mature businesses with history of regular, predictable dividends
(10/n)
1. Cos which have never paid dividend
2. Cos with highly fluctuating dividend payout %
3. Cos with high rate of dividend growth (>20-30%)
Recommended use only for mature businesses with history of regular, predictable dividends
(10/n)
Dividend Discount Model (DDM) - Example #HCLTech
Stock Price = D/(r-g)
D = Rs 42/share (FY22)
r = 12% (Target XIRR)
g = 8%
5 yr PAT growth is 9% so I assume 8% rate of growth for foreseeable future
Fair Value = Rs 1050
Note - DDM is an approximation based on assumptions
END
Stock Price = D/(r-g)
D = Rs 42/share (FY22)
r = 12% (Target XIRR)
g = 8%
5 yr PAT growth is 9% so I assume 8% rate of growth for foreseeable future
Fair Value = Rs 1050
Note - DDM is an approximation based on assumptions
END

Thanks a lot everyone for the extremely warm response to this thread 🙏
As promised, I've shared (via DM) my personal DDM Google sheets pre-populated with DDM for 5+ stocks - #ITC, #HCLTech, #HDFCAMC, #Polyplex, #SwarajEngines
Please DM me if I missed sharing it with anyone.
As promised, I've shared (via DM) my personal DDM Google sheets pre-populated with DDM for 5+ stocks - #ITC, #HCLTech, #HDFCAMC, #Polyplex, #SwarajEngines
Please DM me if I missed sharing it with anyone.
• • •
Missing some Tweet in this thread? You can try to
force a refresh