Thread 🧵⬇️
We will delve into the use of Options Chain analysis as a tool for gaining insights into the market's direction.
We will touch on two concepts - Max Pain and PCR, and how to apply this information to your trading decisions. #OptionsOpenInterest #MarketAnalysis
We will delve into the use of Options Chain analysis as a tool for gaining insights into the market's direction.
We will touch on two concepts - Max Pain and PCR, and how to apply this information to your trading decisions. #OptionsOpenInterest #MarketAnalysis

In this thread, we are going to discuss which tools to use to analyze OI, how to interpret the data and some case studies.
2/18
2/18
We're diving deeper into Option Chain Analysis! Catch up on the basics and join the discussion. #OptionChainAnalysis #OIAnalysis
3/18
3/18
https://twitter.com/132521347/status/1599274884311425024
Before analysing Option Open Interest, we need to make the following assumptions:
1. We are going to analyze this data from an Option Sellers perspective as 90% of the options expire worthless
2. At any point only one party can make money as derivative is a zero-sum game
4/18
1. We are going to analyze this data from an Option Sellers perspective as 90% of the options expire worthless
2. At any point only one party can make money as derivative is a zero-sum game
4/18
To analyze Option Chain, we have to understand two concepts
1. Max Pain
2. Put-Call ratio (PCR)
5/18
1. Max Pain
2. Put-Call ratio (PCR)
5/18
The "theory of max pain" is a popular concept among options traders. It suggests that the price of an underlying asset will move to a level where the most options contracts expire worthless.
6/18
6/18
This theory is based on the idea that options sellers, or "writers," want to see the underlying asset finish at a specific price on the expiration date in order to maximize their profits.
7/18
7/18
To understand how max pain works, it's important to first understand the concept of open interest. This is the total number of options contracts that have been bought or sold but not yet closed.
8/18
8/18
When options contracts expire, the holder has the right (but not the obligation) to buy or sell the underlying asset at the specified price. If the market price is lower than the strike price, the option expires worthless.
9/18
9/18
The theory of max pain suggests that options sellers will try to push the price of the underlying asset to a level where the most options contracts expire worthless. This way, they can maximize their profits.
10/18
10/18
Some traders use the max pain theory as a way to anticipate where the market is headed. They analyze the open interest of various strike prices to determine which one is the "pain point" where the most contracts will expire worthless.
11/18
11/18
While the theory of max pain is a popular concept, it's important to remember that it is just a theory and not a guarantee of future market movements. It's always important to do your own research and analysis before making any investment decisions. #OptionsTrading #MaxPain
12/18
12/18
As you know I use products of Definedge Securities which offers Max Pain, OI, Total Open Interest data and a host of other powerful analytics tools which helps to stay ahead in this game.
For your ease sharing the link here: cutt.ly/B0idCiy
13/18
For your ease sharing the link here: cutt.ly/B0idCiy
13/18
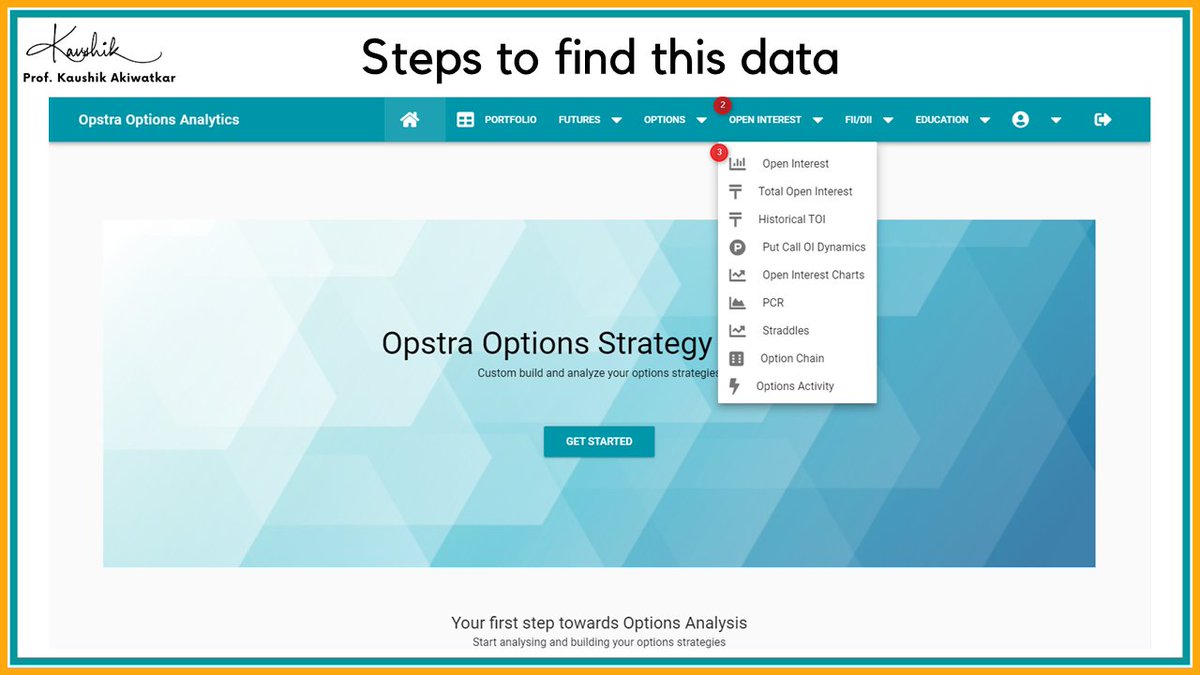
How to find this data:
Step-1) Login to Opstra Pro
Step-2) Click on Open Interest
Step-3) Again click on Open Interest
14/18
Step-1) Login to Opstra Pro
Step-2) Click on Open Interest
Step-3) Again click on Open Interest
14/18

You will find two data points:
1. Max Pain
2. Modified Max Pain
Based on EOD data points Max Pain is calculated and during intraday activity if the Max Pain shifts to different strike it is shown as Modified Max Pain
15/18
1. Max Pain
2. Modified Max Pain
Based on EOD data points Max Pain is calculated and during intraday activity if the Max Pain shifts to different strike it is shown as Modified Max Pain
15/18

PUT-CALL Ratio
It is a way to measure whether traders are feeling bullish or bearish about the market. To calculate it, you just need to divide the open interest of PUT options by that of CALL options.
16/18
It is a way to measure whether traders are feeling bullish or bearish about the market. To calculate it, you just need to divide the open interest of PUT options by that of CALL options.
16/18
PCR is a market sentiment indicator and is used as a contrarian indicator by many traders
Analysing PCR
PCR > 1 is Bullish
PCR = 1 is Neutral
PCR < 1 is Bearish
Above 1.5 and Below 0.5 are extreme zones and are likely places where on-going trend can halt or reverse
17/18
Analysing PCR
PCR > 1 is Bullish
PCR = 1 is Neutral
PCR < 1 is Bearish
Above 1.5 and Below 0.5 are extreme zones and are likely places where on-going trend can halt or reverse
17/18

That's a wrap from OI Analysis!
If you enjoyed this thread then
1. Please re-tweet the first tweet and help me reach more learners
2. Follow me on Twitter @kaushikaki
3. Check out YouTube youtube.com/@TheNoiselessT…
18/18
If you enjoyed this thread then
1. Please re-tweet the first tweet and help me reach more learners
2. Follow me on Twitter @kaushikaki
3. Check out YouTube youtube.com/@TheNoiselessT…
18/18
https://twitter.com/kaushikaki/status/1601811605049819136
• • •
Missing some Tweet in this thread? You can try to
force a refresh


