$TSLA is the talk of anyone #trading#options these days, so I figured it would be good to go through the data to see what the coming days may bring.
First off, there have been several news events related to $TSLA, including Chinese production slow downs, @elonmusk promising not to sell shares, and new gigafactory announcements. All these have made their splash and will continue to do so.
Lets start by looking at flow via @Tradytics. We see a major surge in put buying. However, compared to recent historical premiums, it wasn't the largest. Algoflow actually has this marked as neutral. The EoD spike can be telling though...
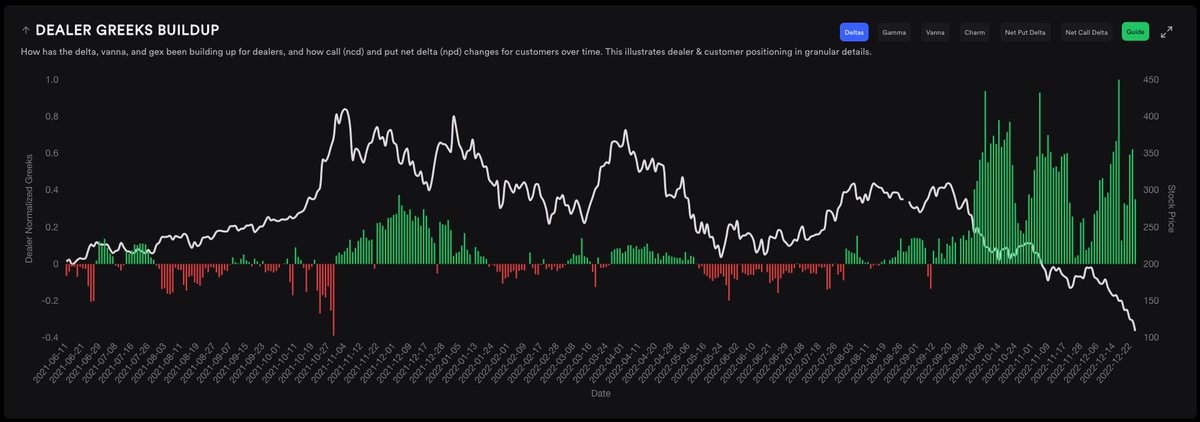
The @Tradytics $TSLA delta correlations still show bearish momentum at play. The 1 day delta correlation is good, but neutral. However, 3 day and 5 day expectations are heavily bearish and very well correlated...
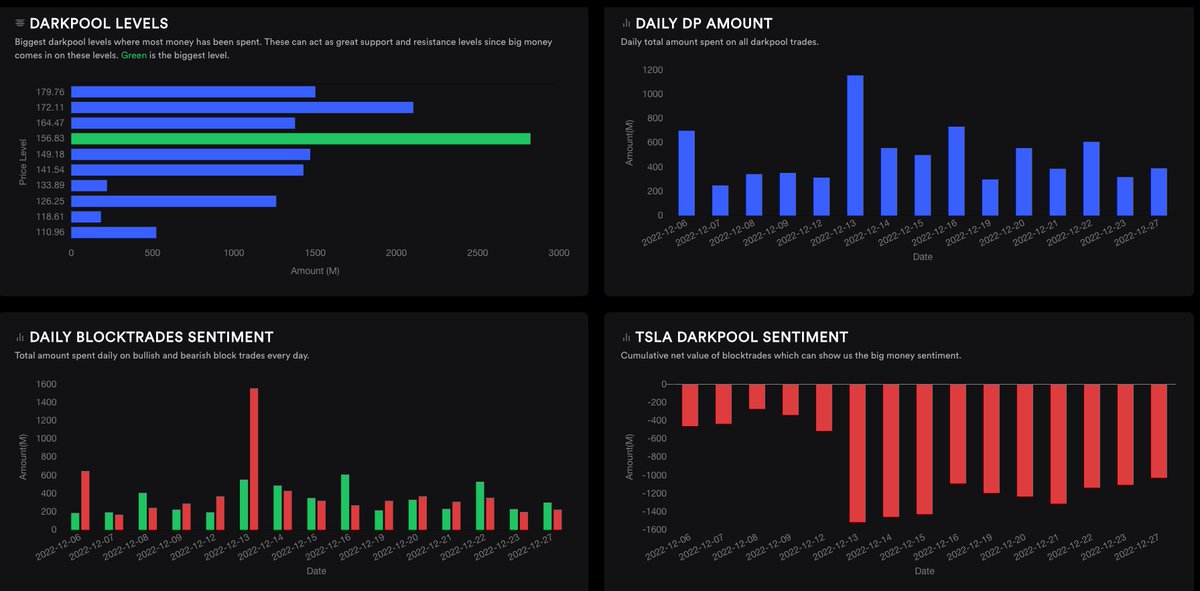
The @Tradytics $TSLA Dark Pool correlations for the next 7 days are also bearish. Block Trade sentiment is bearish and the largest levels are acting as resistance above us. However, here are some bullish prints scattered within.
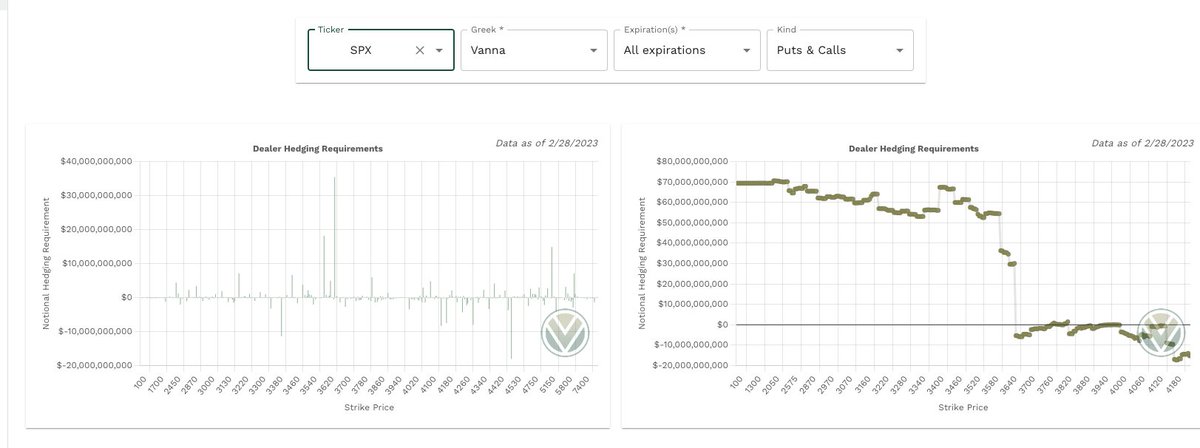
If we use @WizOfOpsVol.land data, we can get a very accurate depiction of dealer side hedging requirements. We can see that $100 will offer some dealer support, but rapid accelerant if shattered. $110 is now resistant (potential magnet).
If we have Vol.land combine the #gamma, #vanna, #charm requirements for us, we see dealers are currently short about 1% of $TSLA's total Notational $ Volume traded today. The shorting gets worse as it goes higher AND lower (see screen shots).
The Daily chart clearly shows a falling knife. No signs of institutions stepping in to buy $TSLA until $95 on the Daily. Personally, I never buy falling knives. I wait for a character change first. Earnings coming up on 1/25/2023 which may halt the descent.
I'm not saying certain days won't present call scalping opportunities, however right now the data shows $TSLA is in a very bad spot. We'll see what the coming days/weeks bring. Be sure to keep an eye on the data as well! A curveball news/earnings event could change everything.
• • •
Missing some Tweet in this thread? You can try to
force a refresh
Lets start with #Vanna on $SPX & $SPY. $SPX cumulative Vanna picture still neutral in this range with positive vanna favoring downside and negative vanna hurting moves higher. $SPY is similar but with more positive vanna favoring downside should $VIX/IV continue to rise.
Aggregate #Charm up next on $SPX & $SPY. $SPX is now much more inline with $SPY with positive charm exceeding negative charm. This means dealer selling will take place as time passes on these contracts.
Another condensed post tonight combining what I believe to be the most useful market data to help prepare for tomorrow. Show thread to see it all! 🧵👇
Lets start with #Vanna on $SPX & $SPY. $SPX cumulative Vanna picture still neutral in this range with positive vanna favoring downside and negative vanna hindering moves higher. $SPY is similar but with more positive vanna favoring downside should $VIX/IV rise.
Aggregate #Charm up next on $SPX & $SPY. $SPX charm is neutral as well, but slightly more negative which is slightly bullish. However, $SPY is still positive which favors downside. Combining the two has dealers doing slightly more selling as time decays.
Someone asked on YouTube if I could review $TSLA data going into the week, so here it goes. Hope others who trade it regularly find it helpful.
$TSLA #Vanna data shows cumulative Vanna positive until 185, at which point it goes negative and would repel moves lower as IV rises with price dropping (within the vanna curve). Positive Vanna around price and above will increase volatility until that point.
Looking at $TSLA Gamma we see dealers assisting moves through 195 and 197.50 due to negative gamma with 200 being a positive gamma which will act as resistance (support if broken). #Charm is slightly more negative which is slightly more bullish.
Here is my evening rundown of $SPY & the overall market using data driven insights by @Tradytics. The data provided will help us formulate a plan for tomorrow to inform our #optionstrading and #futurestrading. Show thread to see it all! 👇
We see Algoflow divergences below. These are assets where net flow is diverging from price. Finance sector and related names stand out as bearish. The bullish names like $U, $GE, $NFLX, $BA & $ENPH warrant a closer look for details.
The $SPY 3-day delta/price correlations show a 30% total chance of moving up to 2.7% higher and a 50% total chance of moving down as much as -3.7% over the next 3 days. Dealers are still long. Expected volatility has dropped slightly.
Here is my evening summary of dealer positioning $SPX, $SPY & $QQQ. The data is provided by Vol.land, created by @WizOfOps, and will help us identify key areas tomorrow to inform our #optionstrading and #futurestrading. Show thread to see it all! 🧵👇
Lets start with #Vanna on $SPX & $SPY. $SPX cumulative Vanna picture is neutral in this range with positive vanna favoring downside and negative vanna hurting moves higher. $SPY is similar but with much more positive vanna favoring downside should $VIX/IV continue to rise.
Aggregate #Charm up next on $SPX & $SPY. $SPX charm is pretty neutral as well, but slightly more negative which is slightly bullish. However, $SPY is very positive which favors downside.
Here is my morning summary of $SPY using data driven insights @Tradytics. The data provided will help us formulate a plan for the day to inform our #optionstrading and #futurestrading. Show thread to see it all! 👇
The $SPY #Gamma based @Tradytics ghost zones are shown in the screen shot below. They range from 397 - 400 currently.
The $SPY 3-day and 5-day delta correlations all favor the upside based on historical correlations between delta structure & price. However, take note of the lower volatility (no ideal for intraday traders).
Dealer delta momentum still more negative (-0.183).