Read less – learn more.
Cut down your PhD or literature review reading list by 75%:
Here is a simple 3-step workflow:
🧵👇
#AcademicChatter #ScienceTwitter #AcademicTwitter
Cut down your PhD or literature review reading list by 75%:
Here is a simple 3-step workflow:
🧵👇
#AcademicChatter #ScienceTwitter #AcademicTwitter
We will use the 80/20 principle and identify the 20% top papers from these 3 categories:
► Most Cited: Foundational, often dated work
► Most Recent: Cutting edge, often no citations
► Most References: Review papers
It's super easy with @LitmapsApp. (free acct is enough)
► Most Cited: Foundational, often dated work
► Most Recent: Cutting edge, often no citations
► Most References: Review papers
It's super easy with @LitmapsApp. (free acct is enough)
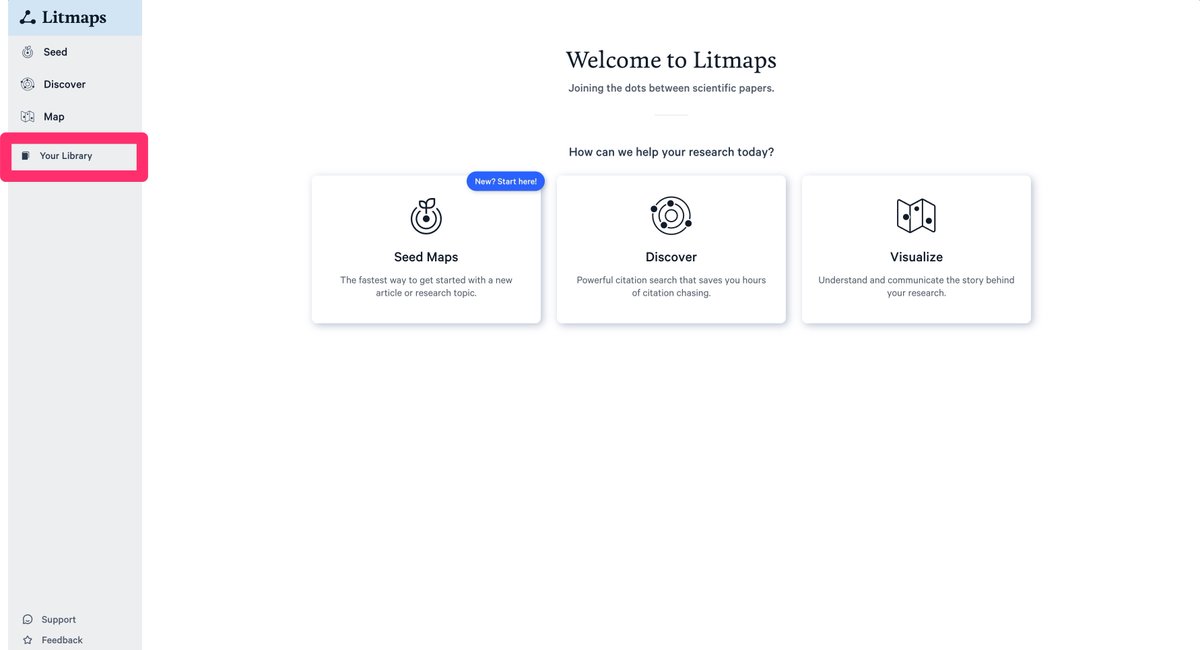
@LitmapsApp 1. Navigate to "Your Library" in Litmaps.
Your library is organised in collections, or folders containing your papers.
(If you're using Zotero, Mendeley etc, I'll show you how to import into litmaps in a second. )
Your library is organised in collections, or folders containing your papers.
(If you're using Zotero, Mendeley etc, I'll show you how to import into litmaps in a second. )
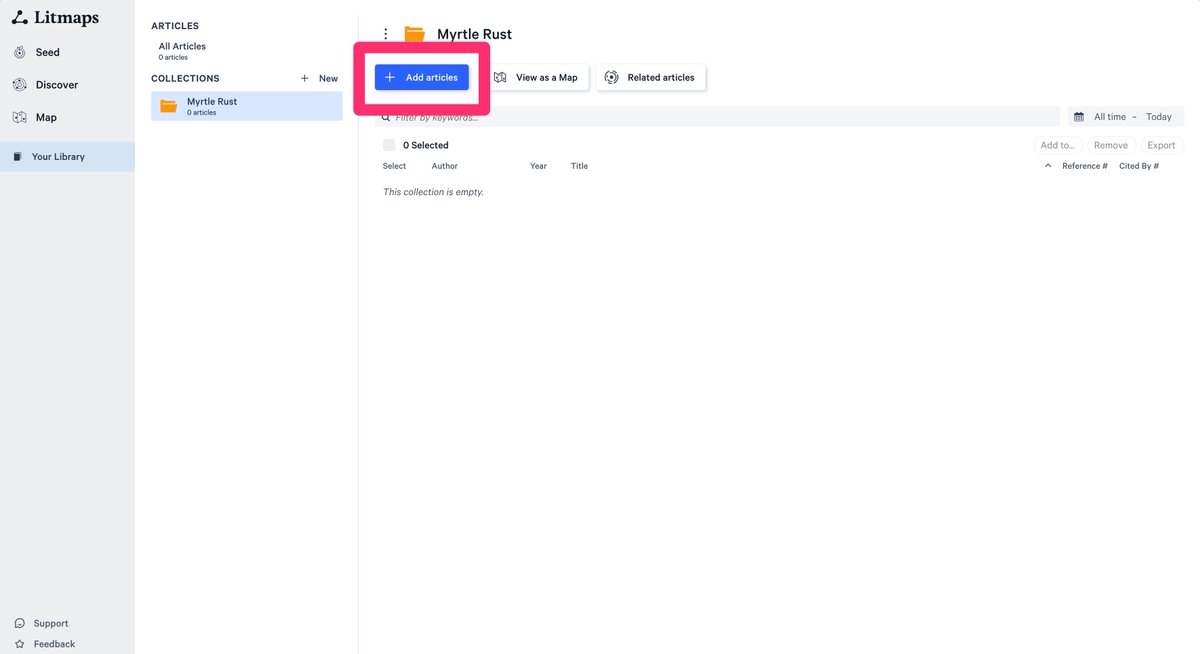
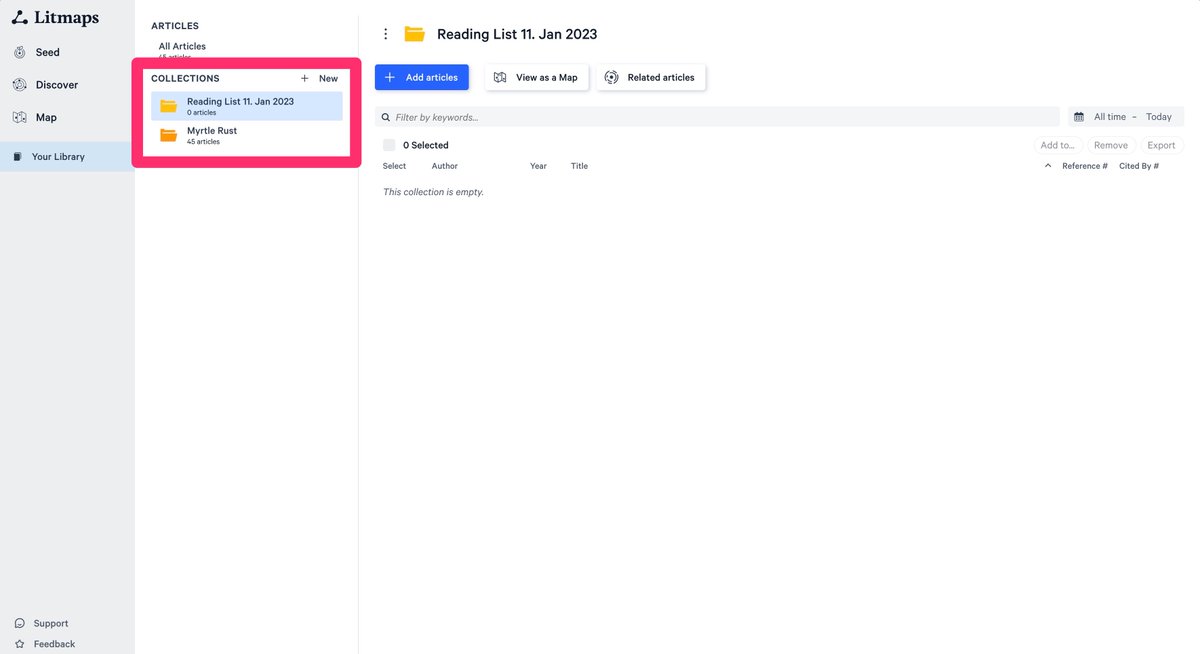
@LitmapsApp 2. Create a collection
A collection is just a folder where you store references. i.e. papers.
As fas as I know, there are no limits on folders or contents in the free version of litmaps. So the free version is enough for this workflow.
A collection is just a folder where you store references. i.e. papers.
As fas as I know, there are no limits on folders or contents in the free version of litmaps. So the free version is enough for this workflow.

@LitmapsApp 3. Import your paper collection
You can either export from Zotero, Mendeley, Paperpile, or do it by hand and type in titles and DOIs.
I assume you have a lot of papers here.
In my example we "only" have 45. But even that would probably take me 2-3 weeks to go through.
You can either export from Zotero, Mendeley, Paperpile, or do it by hand and type in titles and DOIs.
I assume you have a lot of papers here.
In my example we "only" have 45. But even that would probably take me 2-3 weeks to go through.
@LitmapsApp 4. Zotero → Litmaps
Here is how you go from Zotero to Litmaps.
The same export-import flow will work for Mendeley, Paperpile or whatever you are using.
End result: Our papers are now in the collection!
Here is how you go from Zotero to Litmaps.
The same export-import flow will work for Mendeley, Paperpile or whatever you are using.
End result: Our papers are now in the collection!
@LitmapsApp 5. Create a "reading list" collection
We will start putting our selected papers in here.
I call it "Reading List + Date"
We will start putting our selected papers in here.
I call it "Reading List + Date"
@LitmapsApp 6. Filter I: Most Recent
Sort by Year, pick a few papers, add them to our reading list collection.
These papers represent WHERE THE FIELD IS AT.
Use your best judgement to identify what is relevant - don't just take the top ones.
Click on a paper to bring up the abstract.
Sort by Year, pick a few papers, add them to our reading list collection.
These papers represent WHERE THE FIELD IS AT.
Use your best judgement to identify what is relevant - don't just take the top ones.
Click on a paper to bring up the abstract.

@LitmapsApp 7. Filter II: Pick out Review Papers
Sort by "Reference #".
Usually review papers will have more citations than others - but not always. Use best judgement.
"McGlone 2022" in my example now is a review + recent (notice the icon color).
Strong indicator to read it first!
Sort by "Reference #".
Usually review papers will have more citations than others - but not always. Use best judgement.
"McGlone 2022" in my example now is a review + recent (notice the icon color).
Strong indicator to read it first!

@LitmapsApp 8. Filter III: Foundational Papers
Papers that everyone knows in the field, will have high citations.
Sort by "Cited By #" and again pick a few from the top. (Aim at picking no more than 10%)
These papers will usually also be the oldest ones and you should know them!
Papers that everyone knows in the field, will have high citations.
Sort by "Cited By #" and again pick a few from the top. (Aim at picking no more than 10%)
These papers will usually also be the oldest ones and you should know them!

@LitmapsApp 9. We have shortened our reading list
Depending on how "greedy" you are you will shorten your list by more or less.
Here I identified the 40% best papers, saving me potentially weeks.
To see how they are connected, click on "View as Map" in your "Reading List Collection".
Depending on how "greedy" you are you will shorten your list by more or less.
Here I identified the 40% best papers, saving me potentially weeks.
To see how they are connected, click on "View as Map" in your "Reading List Collection".

@LitmapsApp 10. Map
The layout corresponds to our 3 parameters:
X-axis: Date of paper
Y-axis: Number of References (Reviews)
Size of circles: Number of citations.
Here you see how the papers are connected.
Identify the most "central" ones.
Start your reading with these.
The layout corresponds to our 3 parameters:
X-axis: Date of paper
Y-axis: Number of References (Reviews)
Size of circles: Number of citations.
Here you see how the papers are connected.
Identify the most "central" ones.
Start your reading with these.
@LitmapsApp 11. Access any of the papers
Click on the paper in the map or in the overview.
Notice that there is a "view source" button, it will take you directly to the journal.
Click on the paper in the map or in the overview.
Notice that there is a "view source" button, it will take you directly to the journal.

@LitmapsApp 12. Export from Litmaps
You can export your list back to Zotero for example.
One reason is that Zotero can download the PDFs (open access) automatically.
The other reason is that you are taking notes in Zotero - You shouldn't ⛔️
There are better ways ⬇️
You can export your list back to Zotero for example.
One reason is that Zotero can download the PDFs (open access) automatically.
The other reason is that you are taking notes in Zotero - You shouldn't ⛔️
There are better ways ⬇️

@LitmapsApp As you read, take your notes using a system - you will understand & memorise them better.
Link these notes to create a network of understanding,
rather than multi coloured PDFs.
I developed this system of note taking using @obsdmd :
Link these notes to create a network of understanding,
rather than multi coloured PDFs.
I developed this system of note taking using @obsdmd :
https://twitter.com/Artifexx/status/1602904072952381441
@LitmapsApp @obsdmd Use a visual manager with the Obsidian Canvas feature to organise your research as well.
https://twitter.com/Artifexx/status/1607728321663475713
@LitmapsApp @obsdmd Summary
► Import your papers into @LitmapsApp
► Sort by year, reference num and cited by
► Skim the top 10% papers from each category into a reading list
► Use the map view to identify the "central" papers in the reading list.
► Take notes with a system using @obsdmd
► Import your papers into @LitmapsApp
► Sort by year, reference num and cited by
► Skim the top 10% papers from each category into a reading list
► Use the map view to identify the "central" papers in the reading list.
► Take notes with a system using @obsdmd
@LitmapsApp @obsdmd There it is, I hope it's useful.
But is it? You are mostly silent – Maybe this prompt will move you to leave a few thoughts in the comments!
In my profile you can find a link to my in-depth 📩 newsletter as well!
And! As a follower, dozens of tutorials like this await you.
But is it? You are mostly silent – Maybe this prompt will move you to leave a few thoughts in the comments!
In my profile you can find a link to my in-depth 📩 newsletter as well!
And! As a follower, dozens of tutorials like this await you.
• • •
Missing some Tweet in this thread? You can try to
force a refresh