Jan NFP came in 200K+ above the highest Wall Street estimate, UR came in lower than expected, while AHE came mostly in line.
How come Wall Street analysts were all so off?
What does that say about the labor mkt?
Let's dig deeper.
A thread.
1/24
#Fed
How come Wall Street analysts were all so off?
What does that say about the labor mkt?
Let's dig deeper.
A thread.
1/24
#Fed
https://twitter.com/FerroTV/status/1621446859498684416?s=20&t=Wygtilo-EZPvN9kBaIkYSg
Before analyzing the final data, let me explain adjustments and revisions BLS does every Jan:
1) revisions to Establishment Survey data and
2) adjustments to population estimates of the Household Survey
#employment
2/24
1) revisions to Establishment Survey data and
2) adjustments to population estimates of the Household Survey
#employment
2/24
NFP revisions were done only to reflect revisions of total #employment on Mar 2022.
This means that the Philly #Fed report that found 1.1M overstated jobs in Q2 is not reflected in these revisions.
This won't get reflected until Feb 2024.
3/24
philadelphiafed.org/-/media/frbp/a…
This means that the Philly #Fed report that found 1.1M overstated jobs in Q2 is not reflected in these revisions.
This won't get reflected until Feb 2024.
3/24
philadelphiafed.org/-/media/frbp/a…
IOW we won't know the real situation with the latest NFPs for yrs, and once we find out, it probably won't matter anymore bc at that point sth else entirely will be at play.
Still annual NFP revision in Jan added 311K jobs to the already published data in 2022.
4/24
Still annual NFP revision in Jan added 311K jobs to the already published data in 2022.
4/24

Population adjustments are always done as if the whole population changes in just one M (Jan).
No prior data is revised.
For that reason Jan and Dec figures in Household Survey are not easily comparable.
Jan adjustments didn't affect UR but greatly overstated employment.
5/24
No prior data is revised.
For that reason Jan and Dec figures in Household Survey are not easily comparable.
Jan adjustments didn't affect UR but greatly overstated employment.
5/24

On top of the already mentioned annual revisions to Establishment Survey and population adjustments for the Household Survey, BLS is constantly revising its prior data.
This can reflect some meaningful changes in all 3 figures (NFP, UR and AHE) M to M.
6/24
This can reflect some meaningful changes in all 3 figures (NFP, UR and AHE) M to M.
6/24
As the published data keeps changing all the time it is tough to do forecasts with any degree of certainty, especially that of NFP.
Therefore it's not unusual to see M where all Wall Street analysts miss the headline number by a wide margin:
7/24
Therefore it's not unusual to see M where all Wall Street analysts miss the headline number by a wide margin:
https://twitter.com/FerroTV/status/1621446859498684416?s=20&t=Wygtilo-EZPvN9kBaIkYSg
7/24
As @Lavorgnanomics said, NFP are nothing but a random number.
I would add that, although many get hyped over it, NFP don't tell us where #inflation is/will be nor it should be used as a determinant for the #Fed's policy in this environment.
8/24
I would add that, although many get hyped over it, NFP don't tell us where #inflation is/will be nor it should be used as a determinant for the #Fed's policy in this environment.
8/24
https://twitter.com/Lavorgnanomics/status/1621462606211858434?s=20&t=_R1Xm9VbcA9tHSt0f1G_XA
Although these figures will almost certainly get revised lower in the coming M, let's work with what we have for now.
There were strong job gains almost across the board with only mining and finance seeing a slower growth, and IT & utilities seeing (timid) negative growth
9/24
There were strong job gains almost across the board with only mining and finance seeing a slower growth, and IT & utilities seeing (timid) negative growth
9/24

UR ticked down (-0.1 pp) to the cycle low of 3.4%.
Some (including the #Fed) will certainly try to use this as a non-#recession argument but we've had recessions with lower UR.
Also this doesn't mean low UR will cause #inflation. More on this:
10/24
Some (including the #Fed) will certainly try to use this as a non-#recession argument but we've had recessions with lower UR.
Also this doesn't mean low UR will cause #inflation. More on this:
10/24
https://twitter.com/MBjegovic/status/1579869107939594243?s=20&t=wRK9RZyOg0cEWfWO5e4zpw

As usual, AHE are the most important detail of the employment report.
Most would interpret the wage growth number as encouraging bc 3.6% annualized is where the #Fed wants it to be (within the level consistent with 2% #inflation).
But...
11/24
Most would interpret the wage growth number as encouraging bc 3.6% annualized is where the #Fed wants it to be (within the level consistent with 2% #inflation).
But...
11/24
...average workweek went up from 34.4 to 34.7.
Adjusted for the longer workweek, AHE are actually up a staggering 14.1% annualized.
Now this number is clearly off and should be regarded as noise bc there is no way wage growth went up by that much in Jan.
12/24
Adjusted for the longer workweek, AHE are actually up a staggering 14.1% annualized.
Now this number is clearly off and should be regarded as noise bc there is no way wage growth went up by that much in Jan.
12/24
For that reason I suspect in the coming M we will see one of the following:
1) Jan AHE gets revised down compared to Dec
2) Jan workweek gets revised down compared to Dec or
3) both 1) and 2)
13/24
1) Jan AHE gets revised down compared to Dec
2) Jan workweek gets revised down compared to Dec or
3) both 1) and 2)
13/24
Adding to the confusion are the already mentioned BLS revisions of the prior data.
Surprisingly Jan and Mar of 2021 and Feb of 2022 were revised to reflect 0% MoM which is highly unusual (there should have been at least .sth% change +/-).
14/24
Surprisingly Jan and Mar of 2021 and Feb of 2022 were revised to reflect 0% MoM which is highly unusual (there should have been at least .sth% change +/-).
14/24

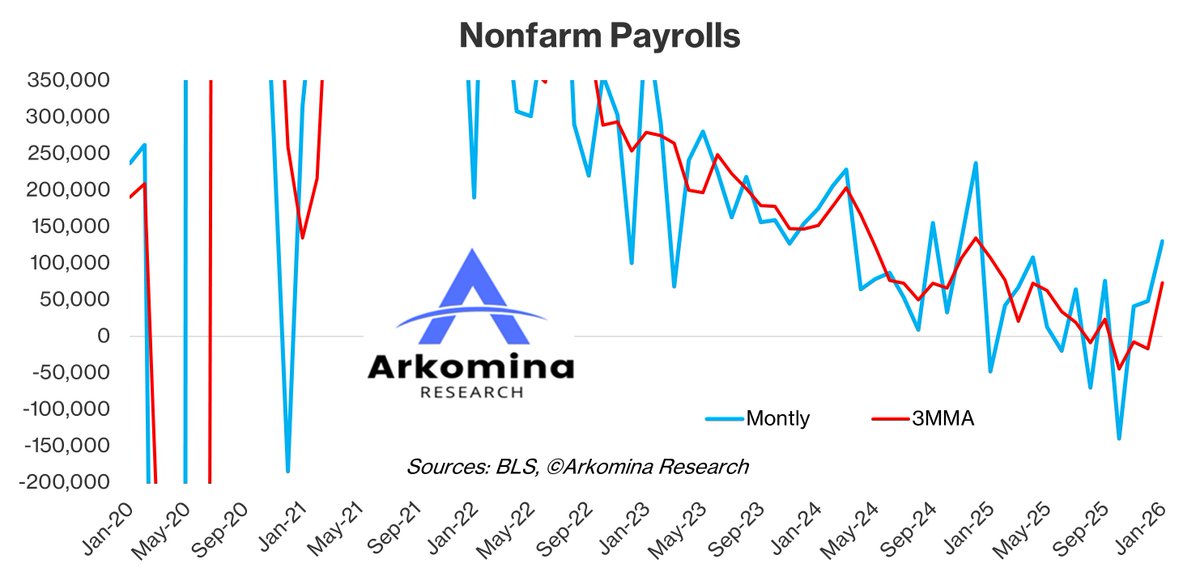
Indeed, if you look at some of my prior charts of the same period, they look somewhat different than the latest one.
BLS is constantly doing revisions of both more recent, as well as some older data painting a (sometimes even substantially) different picture from M to M.
15/24
BLS is constantly doing revisions of both more recent, as well as some older data painting a (sometimes even substantially) different picture from M to M.
15/24


Given the mentioned problems (revisions and unusually higher workweek showing unrealistic numbers), I decided to leave Jan AHE unadjusted for the longer workweek in my analysis.
Also as mentioned on page 13, this will likely get revised to reflect more realistic numbers.
16/24
Also as mentioned on page 13, this will likely get revised to reflect more realistic numbers.
16/24
Probably the most important take from the Jan employment report:
AHE have been below or within the level consistent with 2% #inflation for the last 3M in a row.
#Fed
17/24
AHE have been below or within the level consistent with 2% #inflation for the last 3M in a row.
#Fed
17/24

3MMA MoM annualized AHE in:
1) Oct (4.1%) were were just above the higher bound
2) Nov (3.4%) were within
3) Dec (2.6%) were below
4) Jan (2.2%) were well below
the #Fed's LT wage growth target.
For the last 2M wage growth has been lower than the #Fed wants it to be.
18/24
1) Oct (4.1%) were were just above the higher bound
2) Nov (3.4%) were within
3) Dec (2.6%) were below
4) Jan (2.2%) were well below
the #Fed's LT wage growth target.
For the last 2M wage growth has been lower than the #Fed wants it to be.
18/24

The main #Fed narratives have been disproved by the data:
1) #inflation - "high and sticky" narrative became "services inflation" - but 86%+ and 98% of the CPI disinflated or deflated MoM in Nov and Dec respectively. More details here:
19/24
1) #inflation - "high and sticky" narrative became "services inflation" - but 86%+ and 98% of the CPI disinflated or deflated MoM in Nov and Dec respectively. More details here:
19/24
https://twitter.com/MBjegovic/status/1613624020020383746?s=20&t=mSfGyLFrJxGPEb-t8_xtUw
2) labor market - in his latest comments Powell acknowledged wage growth was not a driver of #inflation
3) no-#recession - such scenario is virtually impossible given what the #Fed has done so far. More in a thread:
20/24
3) no-#recession - such scenario is virtually impossible given what the #Fed has done so far. More in a thread:
https://twitter.com/MBjegovic/status/1618791676289630210?s=20&t=0I5ebmd7eLJRRmIEdQZSoQ
20/24
After the #Fed's latest meeting it is clear we are getting near the pause in rate hikes.
Despite what some have been saying, whether the #Fed pauses now or goes 25 in Mar and then pauses or goes 25 in Mar and May and then pauses, makes little difference.
However...
21/24
Despite what some have been saying, whether the #Fed pauses now or goes 25 in Mar and then pauses or goes 25 in Mar and May and then pauses, makes little difference.
However...
21/24
... there are still some crucial Qs:
1) For how long will the #Fed pause?
2) When will the #Fed cut and by how much?
3) Will #inflation reaccelerate later in the yr like some have said?
4) Will we have a #recession this yr?
5) How will the mkts react to all of that?
22/24
1) For how long will the #Fed pause?
2) When will the #Fed cut and by how much?
3) Will #inflation reaccelerate later in the yr like some have said?
4) Will we have a #recession this yr?
5) How will the mkts react to all of that?
22/24
These threads take a lot of time and effort to write.
If you like the content, please love and retweet to help me spread the message.
23/24
If you like the content, please love and retweet to help me spread the message.
23/24
I will answer all of these important Qs in more detail at my next
Pick Marko's Brain Workshop Tuesday (Feb 7) at 1 pm ET.
Message me to reserve your spot!
24/24
Pick Marko's Brain Workshop Tuesday (Feb 7) at 1 pm ET.
Message me to reserve your spot!
24/24
• • •
Missing some Tweet in this thread? You can try to
force a refresh