Marko Bjegovic Profile picture
Founder/CEO of Arkomina | Investor | Macroeconomist | Stock Picker | Not investment advice (see disclaimer) | https://t.co/RKwv0ZOS4v
5 subscribers
Dec 12 10 tweets 5 min read
Nov #CPI came in line with expectations ydy, but both headline and core printed at +0.3% MoM.

Some have suggested that #inflation is picking back up, but that's not true.

Inflation is much lower than pre-2020.

I'll explain why in a CPI thread.

1/10 My Nov #CPI estimates were:

Headline CPI
+0.28% MoM, -3 bps below the actual +0.31%
+2.72% YoY, -3 bps below the actual +2.75%

Core CPI
+0.35% MoM, +4 bps above the actual +0.31%
+3.36% YoY, +4 bps above the actual +3.32%

You can check them out at this link (no paywall):

#inflation

2/10arkominaresearch.substack.com/p/nov-2024-cpi…
Dec 9 11 tweets 7 min read
I'm a bit late in analyzing the Nov Employment Report, but I think you'll find what I'm about to share quite interesting.

While +227K NFP and 4.2% UR appear strong, there is much more underlying weakness than the headline figures indicate.

I'll explain why in this thread.

1/11 NFP came in at +227K, a bit higher than expected (+200K consensus) which seems pretty strong.

At the same time, Oct was revised up from +12K to +36K.

Oct was heavily disrupted by the weather, and now it seems the number is slightly higher than initially reported, which is what I assumed would happen (x.com/MBjegovic/stat…).

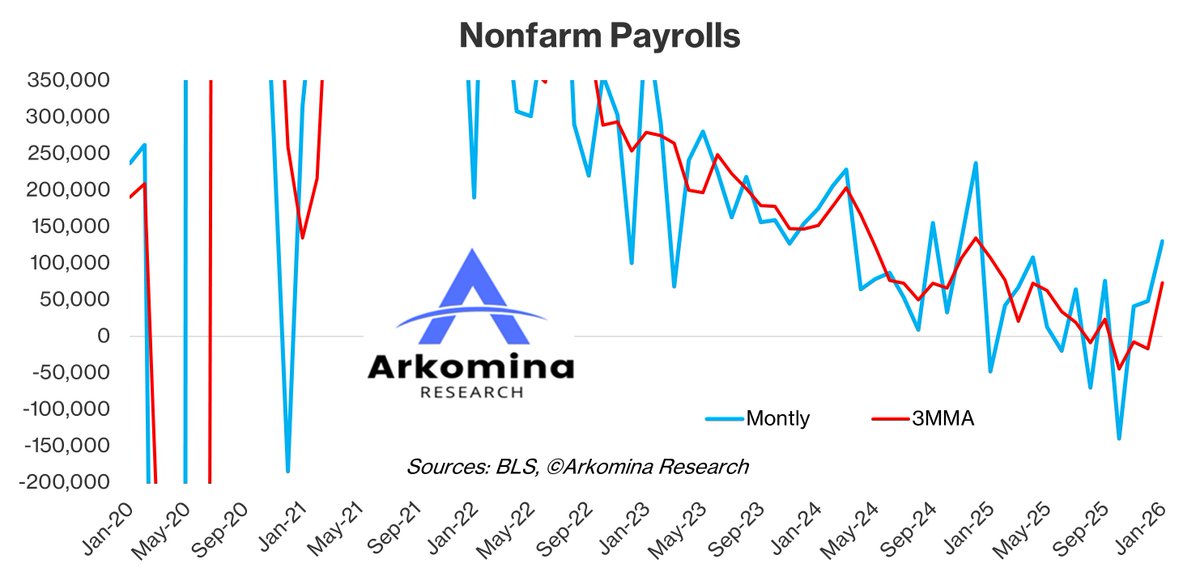
The 2-month avg is currently +132K, slightly weaker than the 6-month avg of +153K before Oct.

One can conclude that the job gains are weakening but not falling off a cliff.

However, the numbers are likely notably weaker than that.

If we factor in that in 12 months ending in Mar 2024, payrolls were overstated by 818K or 68K p/mth on avg, and assume the same thing happened from Apr 2024 onwards, suddenly +64K on average in Oct and Nov doesn't look nearly as strong.

2/11Image
Nov 14 12 tweets 6 min read
Oct #CPI yesterday came in line with market expectations.

After seeing both headline and core CPI rise YoY some concluded that the #inflation progress has stalled or that inflation is picking back up.

None of that is true.

Here is why.

A CPI thread.

1/12 Compared to my estimates Oct #CPI was:

Headline
+0.24% MoM, +4 bps above my estimate
+2.60% YoY, +5 bps above my estimate

Core
+0.28% MoM, +2 bps above my estimate
+3.33% YoY, -2 bps below my estimate

My Oct CPI estimates were published 2 days before
the actual CPI print and are available (no paywall) at this link:

2/12open.substack.com/pub/arkominare…
Nov 2 12 tweets 9 min read
Many believe hurricanes and strikes are making the Oct Employment Report look weaker than it actually was.

However, that's not what the data is telling us.

I will explain why in a thread.

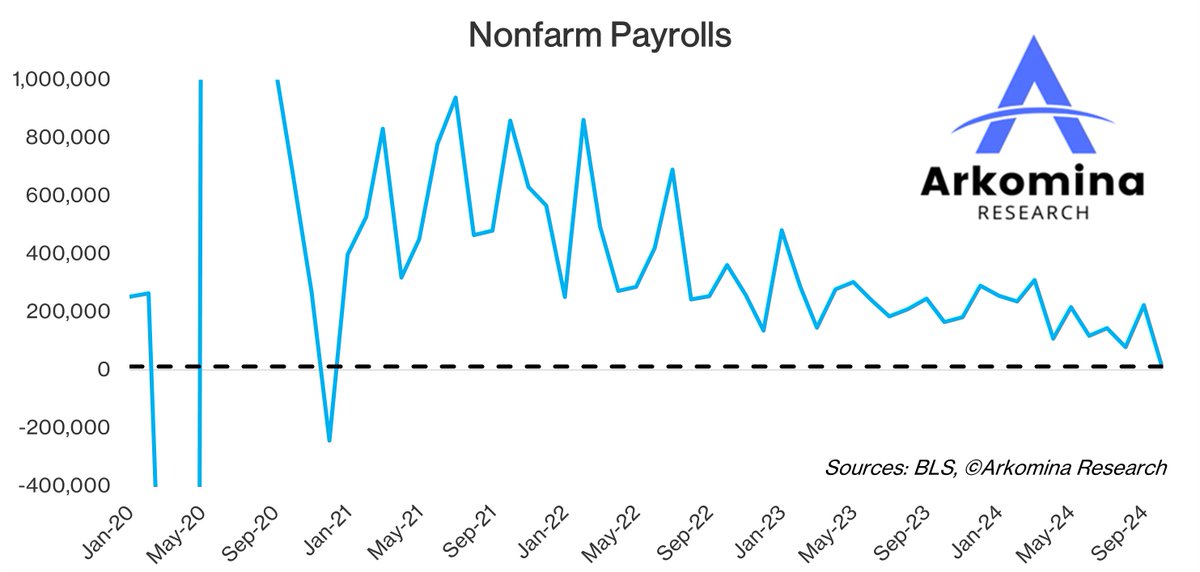
1/12 +12K NFP is the weakest job growth since the last negative print in Dec 2020.

This is also the 2nd lowest read since Apr 2020 (last official #recession).

Again we saw some big negative revisions for prior 2 months which totaled -112K.

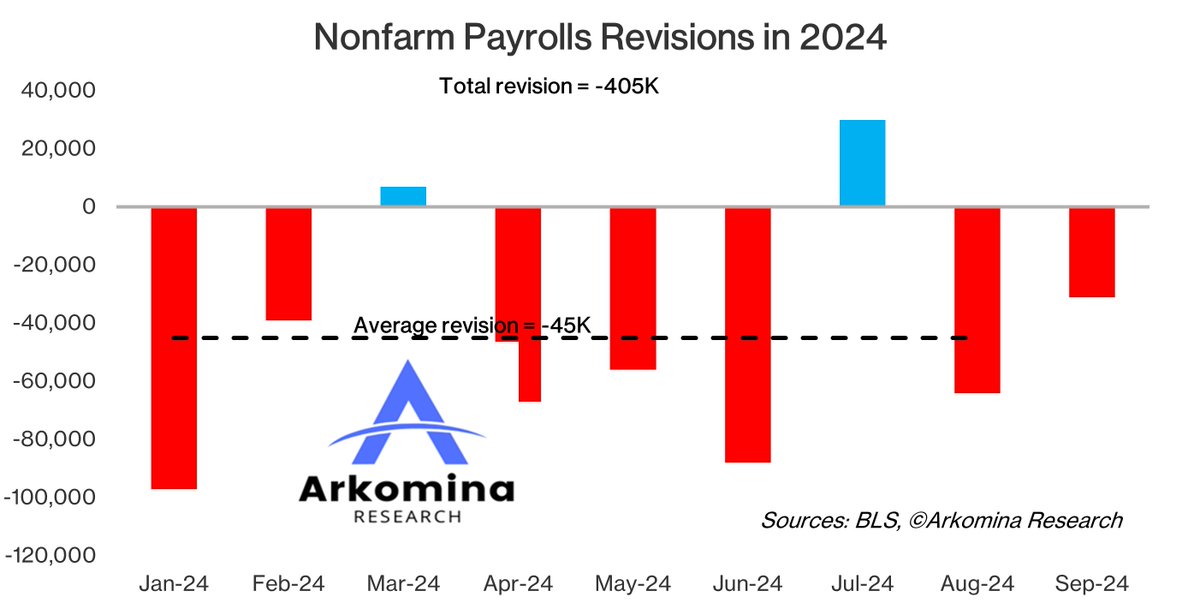
In the first 9 months of this yr NFP were revised down by a total of -405K or -45K on avg.

7 out of 9 months in 2024 were revised down.

The only exceptions are Mar and Jul.

Jul number had hurricane Beryl effect.

Since Oct number was most likely affected by 2 hurricanes (Helene and Milton), maybe we will also see some upward revisions for Oct in the coming months.

Even so, Oct could end up negative after all revisions are done.

How is that possible?

I will explain further in the thread.

2/12Image
Image
Oct 13 12 tweets 7 min read
I'm late to address Sep #CPI but I'm sure you'll love what you're about to see.

Some have suggested #inflation may be reaccelerating due to which the #Fed should pause cuts, but the details show there are no signs of reacceleration.

I'll explain why in a CPI thread.

1/12 Sep #CPI was not far for my MoM estimates, but it came higher than my YoY estimates.

That said, consensus estimates were further away than my forecast.

Headline
+0.18% MoM vs +0.15% my estimate so +3 bps above
+2.44% YoY vs +2.31% my estimate so +13 bps above

Core
+0.31% MoM vs +0.33% my estimate so -2 bps below
+3.31% YoY vs +3.20% my estimate so +11 bps above

My estimates were published a day prior to the official CPI release on Substack (a week before in Marko's CPI Report) and can now be accessed for free on this link:
arkominaresearch.substack.com/p/sep-2024-cpi…

#inflation

2/12
Oct 7 11 tweets 7 min read
By now you've probably heard a lot about how great Sep Employment Report was.

However, the data disagrees with that telling us not only it wasn't "great", but it was so weak that it points to a #recession.

I'll explain why in a thread.

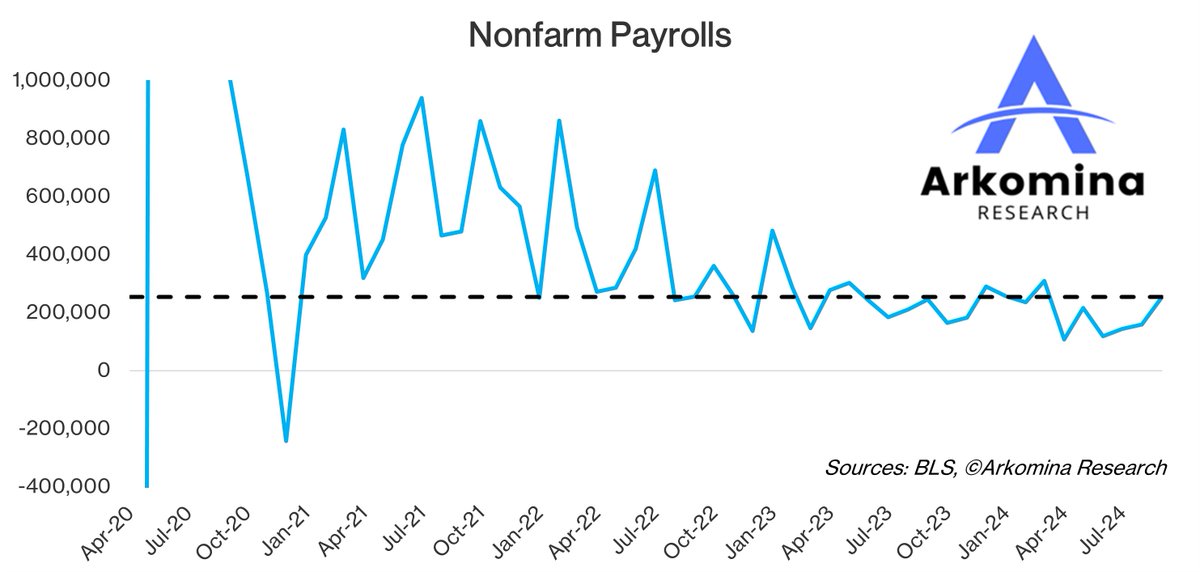
1/11 +254K NFP in Sep coming after +159K in Aug which was revised upward from initial +142K, seems like a great jobs growth.

This means the economy is still going strong, everything is fine, the labor mkt is nowhere near falling off a cliff, right?

Not so fast.

When looking under the hood, we are talking about #recession-ary NFP.

Yes, you read that right.

Explanation follows.

2/11Image
Sep 7 11 tweets 6 min read
I'm a little late to address the Aug Employment Report but I'm sure you will love what you're about to see here.

The employment report shows further labor market weakening adding to #recession fears.

NFP weaker than expected with big prior 2-month downward revisions
UR edged down (barely) in line with expectations
AHE came in slightly hotter than expected

The #Fed hopes to see no further slowing in the labor mkt.

How plausible is that?

An employment thread.

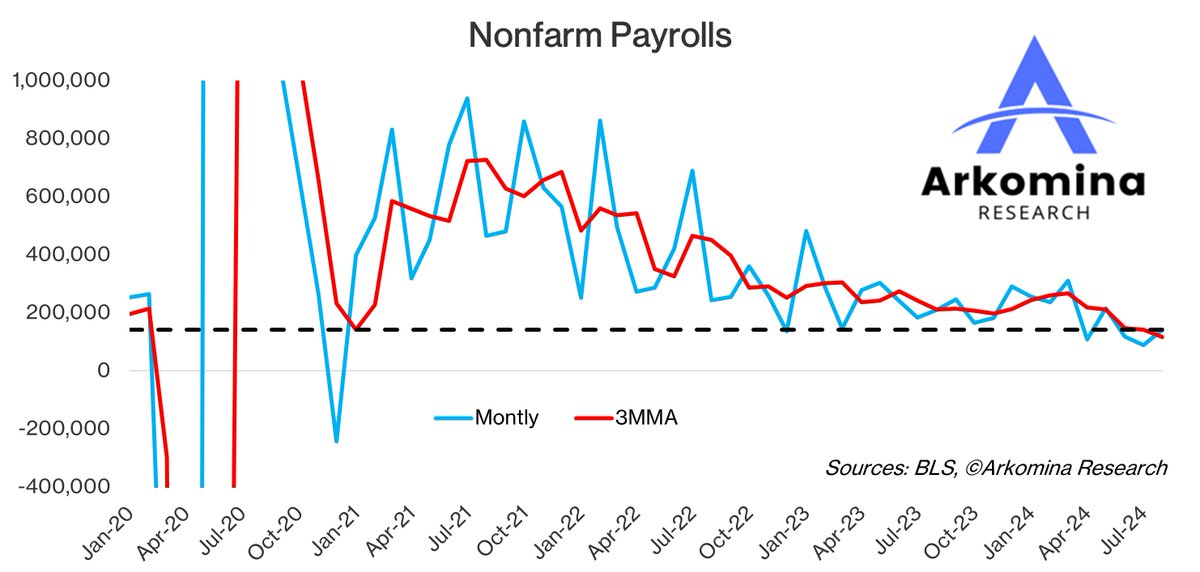
1/11 Aug #NFP came in at +142K, the 5th lowest month since Dec 2020.

3 of 4 months that are lower than Aug came in the last 5 months.

Jul (+89K) was the lowest since Dec 2020.

In the last 3 months NFP averaged only +116K which is the lowest 3-month avg since Jun 2020.

As a reminder, Jun 2020 was still influenced by the last severe #recession in 2020 induced by the first lockdowns.

It seems hard to imagine that just a few months ago we thought the economy was adding 250K-300K jobs per month.

After downward revisions and recent weaker monthly reads, situation has changed.

Almost all of the months in 2024 were revised down so far (save Mar) with a total downward revision of -365K.

To put things into perspective, that's more than 2.5 times larger than Aug NFP.

2/11Image
Image
Apr 10 9 tweets 5 min read
At first glance Mar #CPI looks hot.

Some have even said the #Fed should hike rates from here based on the last 3 months of CPI.

Is #inflation reaccelerating?

Let's delve into details.

A CPI thread.

1/9
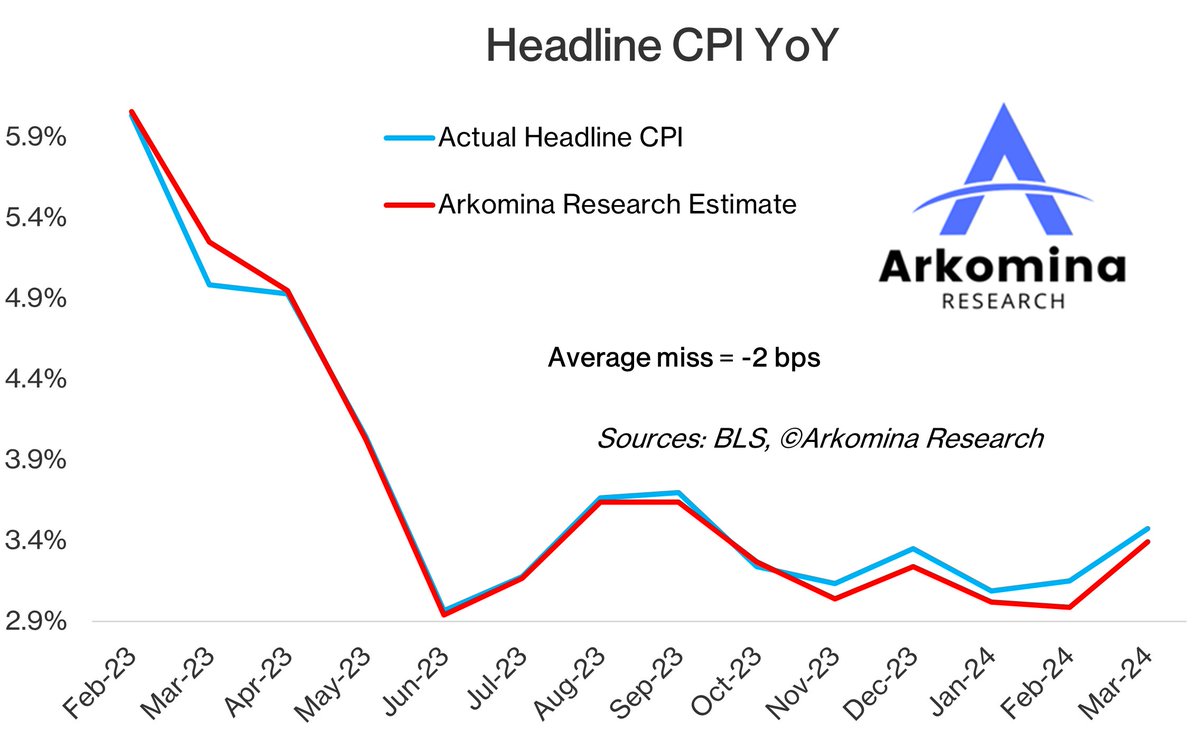
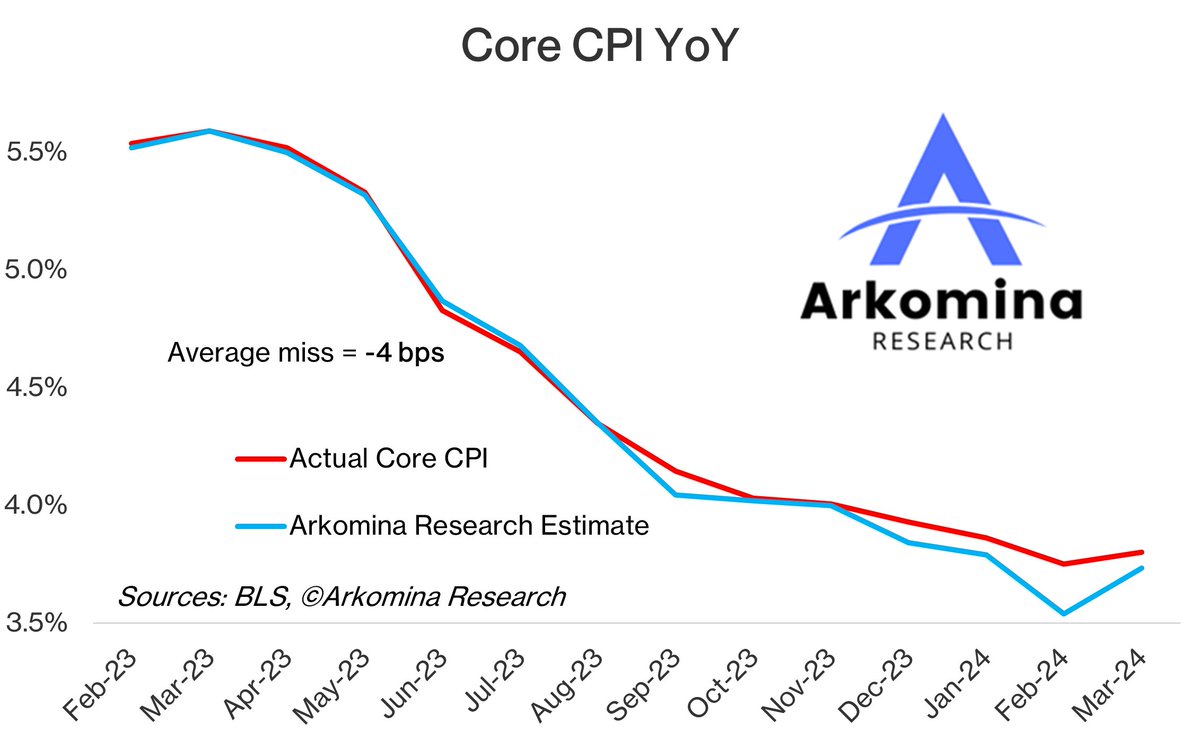
Headline (+3.477% YoY) and core #CPI (+3.801%) were 8 bps and 7 bps higher than I expected respectively.

My Mar estimate is available here (for free): .

My CPI estimates remain exceptionally accurate with an average error of -2 bps for headline and -4 bps for core.

#inflation

2/9substack.com/home/post/p-14…Image
Image
Jan 11 9 tweets 5 min read
Many think Dec #CPI disappointed but actually it wasn't that much hotter than expectations like news headlines may suggest.

In the details, CPI remains pretty cool.

Let's delve deeper under the hood.

A CPI thread.

#inflation

1/9
On the surface headline #CPI was 0.1 pp higher than my estimates for MoM and 0.2 pp higher than my estimates for YoY.

Core was 0.1 pp higher than both my MoM and YoY estimates.


#inflation

2/9
Jan 5 8 tweets 4 min read
Dec Employment Report looks hot on the surface with
💥NFP above +200K
💥UR not going up from 3.7% and
💥AHE running at +0.4% MoM for the 2nd month in a row.

However, there is much more weakness under the hood.

Let's dive deeper into the numbers.

A thread.

1/8
Dec NFP was +216K but Nov and Oct were revised down by a total of -71K with Oct now matching Jun for the lowest NFP number in 3 yrs of only +105K.

So far, almost all months (save Jul) were revised down in 2023 with total downward revision close to -0.5M.

If Dec is revised down in line with the avg revision in the last 3 months (-48K) NFP could end up in line with +170K consensus.

So the total downward revision in 2023 would equal all job gains in Q4.

Downward revisions of such magnitude and persistence don't happen in either strong nor tight labor mkt like some, including the #Fed, have been describing it.

2/8Image
Sep 13, 2023 9 tweets 3 min read
Headline CPI at +3.7% YoY (it was +3.0% 2M ago) which is 0.1 pp higher than expected.

Core CPI at +0.3% MoM, again +0.1 pp higher than expected.

Are there reasons for us and the Fed to worry?

Let's delve deeper.

A CPI thread.

1/9
For accountability purposes, I'll say that headline came +0.1 pp higher on YoY basis and +0.1 pp higher on MoM basis than my estimates, while MoM headline and YoY core came in line with my estimates.


2/9x.com/MBjegovic/stat…
Aug 29, 2023 6 tweets 4 min read
Lots of chatter around the latest #JOLTS number that went down to 8.827M, the lowest level since Mar 2021 (8.399M).

Important to note a few things:
1) despite the #Fed frequently saying it, this number was never representative of real labor demand bc it has included many fake job openings (IOW it has overstated labor demand by a wide margin which was especially evident after the lockdowns in 2020/2021)
2) right now JOLTS vs unemployed is 1.5 and the Fed wants to see it at 1. However, there is no guarantee this number will stop falling once it equates with unemployed ppl
3) by the time 2) happens this may actually mean that unemployed ppl are already way above JOLTS bc of 1)
4) if 3) is true this also means that #UR will go way above the Fed's desired level
5) Fed's desired UR is recessionary. IOW they have been expecting and hoping for a #recession while trying to convince every1 #softlanding is their base case

A short thread.

1/6 When the #Fed gets misled by inaccurate numbers like #JOLTS or lagging numbers like #CPI/#PCE one thing is certain - they will overdo it, no matter which direction they go.

And that is what they have done.

First they were 1 yr late to start tightening.

If they don't hike from here they will be 1 yr late to stop raising rates.

If they hike one more time this yr like they say they will then they will be even more late.

In this 1 yr so far they hiked by an unnecessary 300 bps.

At one point chickens will come home to roost.

When the lags from all of these (mostly unnecessary) hikes play out, we will get a long (maybe even severe) #recession.

2/6
Aug 9, 2023 7 tweets 2 min read
Tomorrow we will get Jul #CPI.

Lots of worries around gasoline prices and what will they mean for the #inflation in both July and going forward, as this will be a determinant of the #Fed's policy going forward.

So, where will Jul CPI print at?

A thread.

#inflation

1/7
Before we get to the #CPI estimates, oil prices have (finally) broken to new 2023 highs tdy.

Still, that doesn't necessarily mean that we will see higher #inflation going forward.

More on this in a days old tweet:


2/7
Jul 17, 2023 11 tweets 4 min read
Just realized I forgot to address the stellar Jun #CPI report.

I'm sure you've seen a lot about it by now but you definitely haven't seen what you're about to see here.

A CPI thread.

#inflation

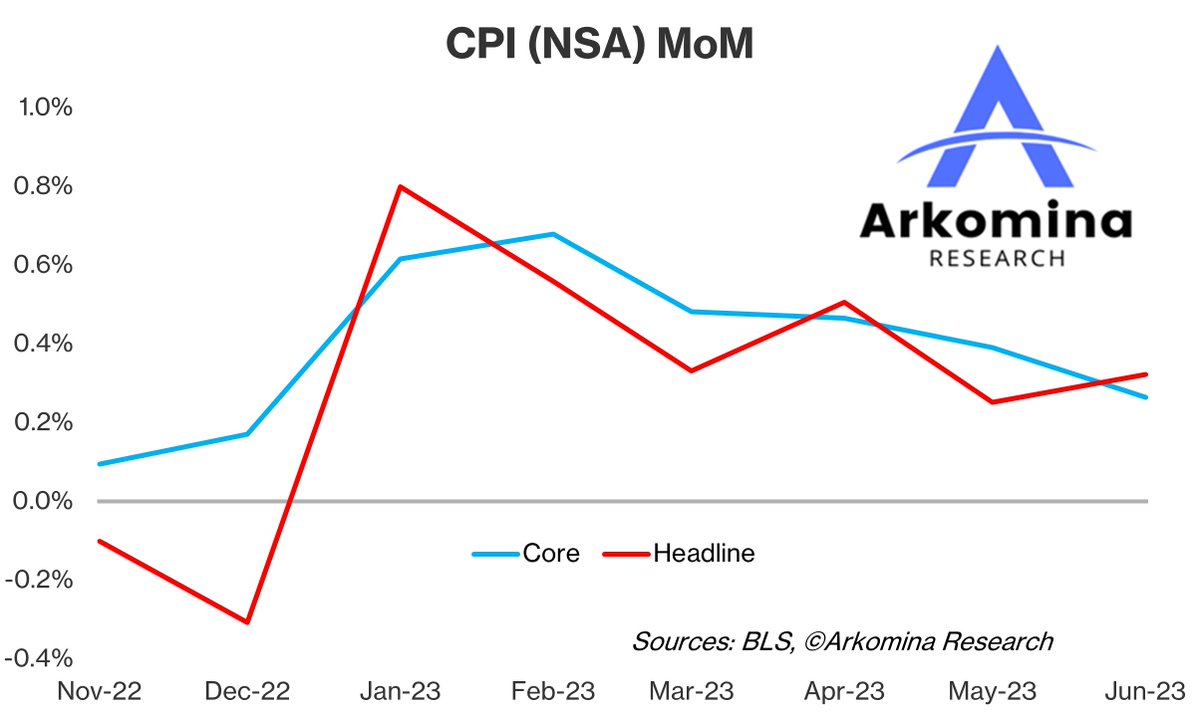
1/11 #CPI
+0.2% MoM for headline and core
YoY headline +2.97% and core +4.83%

Better than consensus in every aspect.

I was 🎯 for MoM figures, but also 0.1 pp too optimistic for the headline and 4 bps too pessimistic for the core.

#inflation

2/11

Jun 2, 2023 11 tweets 6 min read
May employment report came in mixed with both NFP and UR increasing.

Again, no Wall Street analyst came nowhere close to guessing the headline number with the highest estimate missing it by 129K.

What does that all mean for the #Fed?

A thread.

1/11
NFP rose for the 29th M in a row with +339K which is 149K above consensus (+190K).

Apr number was revised up by 41K from +253K to +294K.

Total gain in Apr and May is +633K, 190K higher than expected (+443K).

#employment

2/11
Mar 31, 2023 8 tweets 6 min read
Feb #PCE, #Fed's preferred measure of #inflation, came in cooler than expected.

But 1M doesn't make a trend.

What does the #PCE tell and what it all means for the #Fed?

Let's dig deeper.

A thread.

1/
As I said in in the Jan #PCE thread, Jan reading looks a lot like Oct. Both were outliers in an otherwise deflationary trend since July.


#inflation

2/8 Image
Mar 28, 2023 16 tweets 12 min read
Time to update this chart.

With everything going lately this may be the single most important chart to look at.

What do the latest numbers tell us?

A thread.

#inflation

1/16 I made the quoted tweet on Feb 2 which was before Jan employment report, #CPI , #PPI and #PCE when most were still talking about great Dec numbers.

In the meantime most indicators showed higher #inflation numbers but, as I noted beforehand, that is only seasonality.

2/16 ImageImage
Feb 25, 2023 13 tweets 10 min read
Jan #PCE came in hotter than expected tdy.

After Jan employment report, #CPI and #PCE some have been calling for the #Fed to step up their hikes in order to solve the #inflation problem.

Should the #Fed do it?

A thread.

1/13 Before we go into the #PCE details, here is a comprehensive overview of the Jan employment report:


#inflation

2/13
Feb 18, 2023 17 tweets 12 min read
@LynAldenContact suggests Taylor Rule implies 10.2% FFR citing @stlouisfed FRED (#Fed).

Is 10.2% really what Taylor rule suggests the FFR should be currently at?

A thread.

1/13 Taylor Rule:

FFR = R* + 0.5 (GDP est - potential GDP) + 0.5 (inflation est - 2)

R* - natural interest rate (estimates vary from 2-2.5%); IOW FFR which is neither expansive nor restrictive

#Fed's Dec projections:

GDP est - 0.5%

Potential GDP - 1.8%

Inflation est - 3.1%

2/13
Feb 13, 2023 12 tweets 7 min read
The long awaited Jan #CPI report goes out tomorrow (Feb 14) at 8:30 am ET.

Lots of talks about BLS revisions of their seasonal adjustments and whether #inflation is picking up again.

So where will the #CPI print at?

A thread.

1/11 Friday BLS published revised figures for SA #CPI data 2018-2022 with recent figures gathering attention bc they were revised somewhat higher.

This sparked speculations whether they purposely did that to make future figures look lower than they otherwise would be.

2/11
Feb 3, 2023 24 tweets 13 min read
Jan NFP came in 200K+ above the highest Wall Street estimate, UR came in lower than expected, while AHE came mostly in line.

How come Wall Street analysts were all so off?

What does that say about the labor mkt?

Let's dig deeper.

A thread.

1/24

#Fed

Before analyzing the final data, let me explain adjustments and revisions BLS does every Jan:
1) revisions to Establishment Survey data and
2) adjustments to population estimates of the Household Survey

#employment

2/24