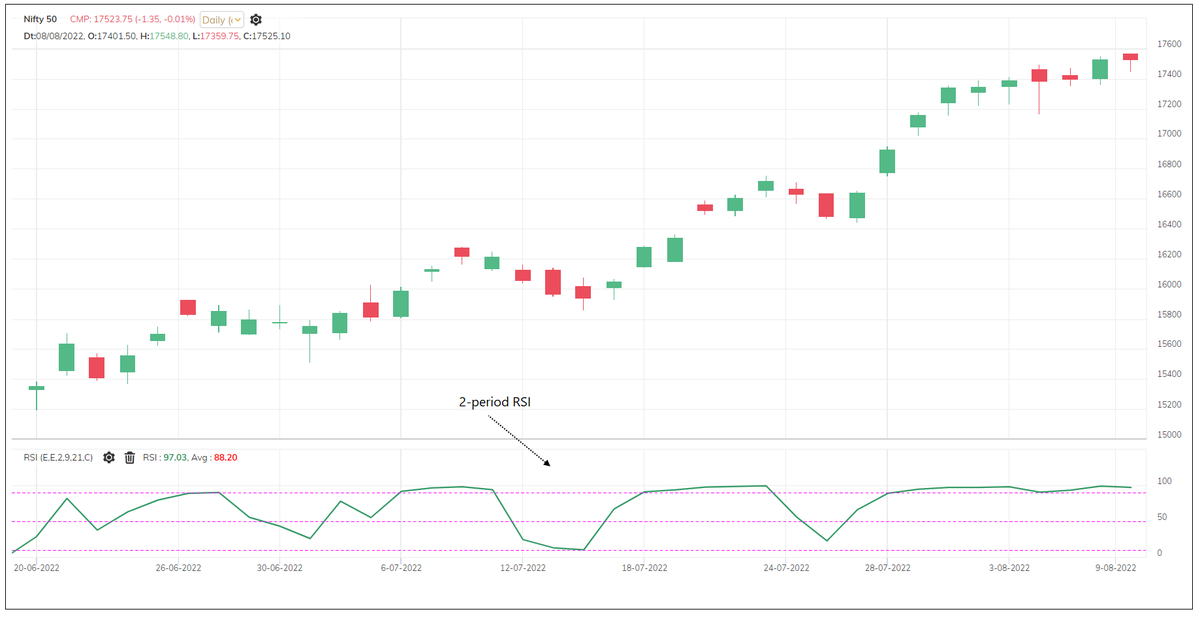
14 is a widely followed period for RSI. If you plot 14-period RSI, it calculates a ratio of bullish prices in the last 14 candles.
As a result, a higher RSI indicates a higher ratio of average bullish prices.
Thread on RSI indicator to learn more

As a result, a higher RSI indicates a higher ratio of average bullish prices.
Thread on RSI indicator to learn more
https://twitter.com/Prashantshah267/status/1274221823081639936?s=20

There are many ways to use the RSI indicator.
RSI above 50, overbought-oversold zone, positive – negative divergences, RSI and signal line crossover etc.
How about reducing the noise of the RSI indicator?
RSI above 50, overbought-oversold zone, positive – negative divergences, RSI and signal line crossover etc.
How about reducing the noise of the RSI indicator?
See the chart.
Move A is an uptrend. It’s a bullish swing.
Instead of calculating RSI in every candle, how if we calculate it just once for the entire swing? Since the price is up only.
Move A is an uptrend. It’s a bullish swing.
Instead of calculating RSI in every candle, how if we calculate it just once for the entire swing? Since the price is up only.

See move B in the below chart. It’s a bearish swing.
We can calculate one RSI for this swing.
The idea is to calculate RSI for the entire swing rather than for every candle.
This way, we can reduce the fluctuation in the RSI indicator.
We can calculate one RSI for this swing.
The idea is to calculate RSI for the entire swing rather than for every candle.
This way, we can reduce the fluctuation in the RSI indicator.

We can easily achieve that using P&F charts.
P&F chart plots the entire swing as a column. Price will remain in column X as long as the trend is bullish. Price remains in column O if the trend is bearish.
Therefore, a single column can have multiple sessions in it.
P&F chart plots the entire swing as a column. Price will remain in column X as long as the trend is bullish. Price remains in column O if the trend is bearish.
Therefore, a single column can have multiple sessions in it.
A column in the P&F chart represents one swing or one trend.
When we plot 14-period RSI on the P&F chart, it calculates RSI on the last 14 columns. That is, the last 14 swings, the last 14 trends.
How many sessions?
Price trends will decide that.
When we plot 14-period RSI on the P&F chart, it calculates RSI on the last 14 columns. That is, the last 14 swings, the last 14 trends.
How many sessions?
Price trends will decide that.

There will be a single RSI reading for the entire column (trend).
Have a look at the chart below for the same instrument (Nifty) and timeframe.
Observe the RSI on both charts.
Have a look at the chart below for the same instrument (Nifty) and timeframe.
Observe the RSI on both charts.
RSI calculated on swings (P&F) eliminates the noise of the RSI indicator. Makes it smoother.
We can call it Noiseless RSI :-)
All methods of RSI indicator analysis can be applied to RSI on P&F charts as well.
We can call it Noiseless RSI :-)
All methods of RSI indicator analysis can be applied to RSI on P&F charts as well.
This results in a different version of RSI. While the formula remains the same, the nature changes. RSI of swing instead of candles.
Even if you know basic P&F signals, they can be filtered with RSI and many decent trading systems can be designed using a combination of them.
Even if you know basic P&F signals, they can be filtered with RSI and many decent trading systems can be designed using a combination of them.
You can also use a combination of RSI on candlestick & P&F charts.
RSI is an example. This way, you can take advantage of the nature of P&F charting & remove the noise of any indicator.
The concept is fascinating. Spend some time on it, and you'll see how effective it is.
RSI is an example. This way, you can take advantage of the nature of P&F charting & remove the noise of any indicator.
The concept is fascinating. Spend some time on it, and you'll see how effective it is.
• • •
Missing some Tweet in this thread? You can try to
force a refresh