
The White House insists, ‘no’, the Fed muses, ‘maybe’, and bond markets say, ‘yes’
But who's right? Are we headed for a recession or not?
Time for a macro 🧵👇
But who's right? Are we headed for a recession or not?
Time for a macro 🧵👇
🧐 What is a Recession?
Let’s start with the basics, shall we?
What is a recession, and before predicting any, how can we tell that we are, in fact, in one?
Let’s start with the basics, shall we?
What is a recession, and before predicting any, how can we tell that we are, in fact, in one?
Well, using various economic definitions and descriptions, a recession is simply a period of economic decline lasting at least six months
Indicators of a recession include:
• a decrease in GDP,
• rising unemployment,
• and reduced spending by consumers and businesses.
Indicators of a recession include:
• a decrease in GDP,
• rising unemployment,
• and reduced spending by consumers and businesses.
I know, I know, we had two consecutive quarters of lower GDP last year
But conflicting data, like low unemployment, rising wages (even if not quite keeping up with inflation—I mean, do they ever? 🙄), and increased spending all pointed to an economy not really contracting
Yet.
But conflicting data, like low unemployment, rising wages (even if not quite keeping up with inflation—I mean, do they ever? 🙄), and increased spending all pointed to an economy not really contracting
Yet.
But the Fed is looking to change that
By raising rates like a rocket, jacking up Fed Funds by almost 5 full percent in the last twelve months, the Fed is looking to tighten financial liquidity (i.e., access to cheap money) and squash demand in order to lower inflation
🚀🚀🚀
By raising rates like a rocket, jacking up Fed Funds by almost 5 full percent in the last twelve months, the Fed is looking to tighten financial liquidity (i.e., access to cheap money) and squash demand in order to lower inflation
🚀🚀🚀

So, even as the Fed speaks from both sides of its mouth
i.e., we need unemployment higher and prices lower, but we can still avoid a recession,
they know in their dark little hearts they must induce economic pain to tackle the stickiest 'transitory' inflation they've ever seen.
i.e., we need unemployment higher and prices lower, but we can still avoid a recession,
they know in their dark little hearts they must induce economic pain to tackle the stickiest 'transitory' inflation they've ever seen.
But why do they do this?
Why use silly terms like ‘soft landing’—whatever that even means—when describing what they know damned well to be hurtful economic contraction
Say it with me: *Recession*
Maybe a little history will helps us better understand...
Why use silly terms like ‘soft landing’—whatever that even means—when describing what they know damned well to be hurtful economic contraction
Say it with me: *Recession*
Maybe a little history will helps us better understand...
See, back in the 70s, Cornell economist Alfred Kahn was appointed chairman of President Carter's Council on Wage and Price Stability
Basically, Kahn was responsible for overseeing the federal government's efforts to control inflation
Kahn was referred to as the Inflation Czar.
Basically, Kahn was responsible for overseeing the federal government's efforts to control inflation
Kahn was referred to as the Inflation Czar.
However, Kahn was constantly in trouble with Carter and his cabinet lackeys for referring to the terrible economic conditions of the time as a “depression” or “recession"
Known for his use of plain and simple English in the classroom, this annoyed Kahn to no end.
Known for his use of plain and simple English in the classroom, this annoyed Kahn to no end.
His response? Fine, I’ll use the word 'banana' instead
And so, quoted in the Washington Post, Kahn said, "Between 1973 and 1975 we had the deepest banana that we had in 35 years, and yet inflation dipped only very briefly"
Sounds like *soft-landing* really means *banana*.
And so, quoted in the Washington Post, Kahn said, "Between 1973 and 1975 we had the deepest banana that we had in 35 years, and yet inflation dipped only very briefly"
Sounds like *soft-landing* really means *banana*.
OK. If we can’t trust their words, what can we trust?
That’s right. Data.
Cold. Hard. Real.
The true indicators.
That’s right. Data.
Cold. Hard. Real.
The true indicators.
🤨 Yield Curves
You may have heard me talk about this before, but a leading indicator of a coming recession is the inversion of the Treasury yield curve
It's one of the earliest indicators we have, and it’s also one of the most reliable.
You may have heard me talk about this before, but a leading indicator of a coming recession is the inversion of the Treasury yield curve
It's one of the earliest indicators we have, and it’s also one of the most reliable.
For those new to this, I’ve written all about yield curve inversions and simplified the concept thoroughly here:
jameslavish.substack.com/p/yield-curve-…
jameslavish.substack.com/p/yield-curve-…
For you TL;DR-ers':
When longer dated Treasuries, like the 10-year, have lower yields than shorter maturities, like the 3-month or 2-year, this indicates an economy is headed for trouble.
When longer dated Treasuries, like the 10-year, have lower yields than shorter maturities, like the 3-month or 2-year, this indicates an economy is headed for trouble.
There are a host of reasons for this that you can read all about in the article above
But suffice to say that the inversion of the 10yr-2yr and 10yr-3mo curves usually happens somewhere between 6 to 18 months before the *actual onset* of a recession.
But suffice to say that the inversion of the 10yr-2yr and 10yr-3mo curves usually happens somewhere between 6 to 18 months before the *actual onset* of a recession.
Case and point, here’s the historical 10yr-2yr spread with blue bars indicating periods of recession:

and the 10yr-3mo spread:

A few notes
First, the 10yr-3mo spread (2nd chart) seems to be the most reliable indicator
Second, it appears that curve inverted in October, and the 10yr-2yr inverted even earlier, back in July, which puts a recession on the table for anywhere from mid-2023 to early 2024.
First, the 10yr-3mo spread (2nd chart) seems to be the most reliable indicator
Second, it appears that curve inverted in October, and the 10yr-2yr inverted even earlier, back in July, which puts a recession on the table for anywhere from mid-2023 to early 2024.
Third, the magnitude of both inversions hasn’t been this deep since the 1980’s (for those of you lucky enough not to live through that one, it sucked. Period)
And lastly, the inversions appear to just be getting worse.
Lovely.
And lastly, the inversions appear to just be getting worse.
Lovely.
🤑 GDP, GDI & Corporate Profits
One big red flag is that the Bureau of Economic Analysis’ (BEA) two main measures of economic activity diverged in the fourth quarter
GDP and GDI.
One big red flag is that the Bureau of Economic Analysis’ (BEA) two main measures of economic activity diverged in the fourth quarter
GDP and GDI.
Gross Domestic Product (GDP) is the total market value of all finished goods and services produced by an economy,
and Gross Domestic Income (GDI) is the total income generated by an economy in a given period.
and Gross Domestic Income (GDI) is the total income generated by an economy in a given period.
When these diverge, there’s a profitability issue
To simplify: the cost to produce goods is rising, while income generated from that production is decreasing
A Business 101 *no-no*
To simplify: the cost to produce goods is rising, while income generated from that production is decreasing
A Business 101 *no-no*
Low and behold, GDP rose 2.6%, while GDI fell by 1.1% in the last quarter.
(oops?)
(oops?)

Digging deeper, let’s turn to corporate profits, as that’s an actual indication of a contraction of profitability.
In short, pre-tax corporate profits also fell 2% in the last quarter of 2022:
In short, pre-tax corporate profits also fell 2% in the last quarter of 2022:

And, in an echo of the GDP/GDI indicator, the S&P 500’s net-income-to-sales ratio for the first quarter of 2023 also dropped steeply

It’s therefore no surprise that 93% of CEOs are preparing for a recession in 2023,
and over half believe that a global recession is their *greatest challenge* for the year ahead:
and over half believe that a global recession is their *greatest challenge* for the year ahead:

OK, so it seems companies and executives are starting to see and feel signs of contraction
What else?
While there're many other places we can look, like housing, intricate sales data, etc., some places we look can give us a false sense of confidence
Let’s talk about that next.
What else?
While there're many other places we can look, like housing, intricate sales data, etc., some places we look can give us a false sense of confidence
Let’s talk about that next.
🤥 False Confidence Signals
One of the signals that we consistently hear investors key in on is employment
I mean, if people are not losing their jobs, then the economy must be ok, right?
One of the signals that we consistently hear investors key in on is employment
I mean, if people are not losing their jobs, then the economy must be ok, right?
All we hear from the Fed is: *no unemployment = no recession*
Seems reasonable
Until we look at the facts. The *data*.
Seems reasonable
Until we look at the facts. The *data*.
Check out this chart, for instance, and look carefully at when unemployment rises versus when a recession starts
Huh
Looking at rising unemployment as an indicator of a coming recession seems kind of like crossing the street and watching for cars as a bus silently flattens you.
Huh
Looking at rising unemployment as an indicator of a coming recession seems kind of like crossing the street and watching for cars as a bus silently flattens you.
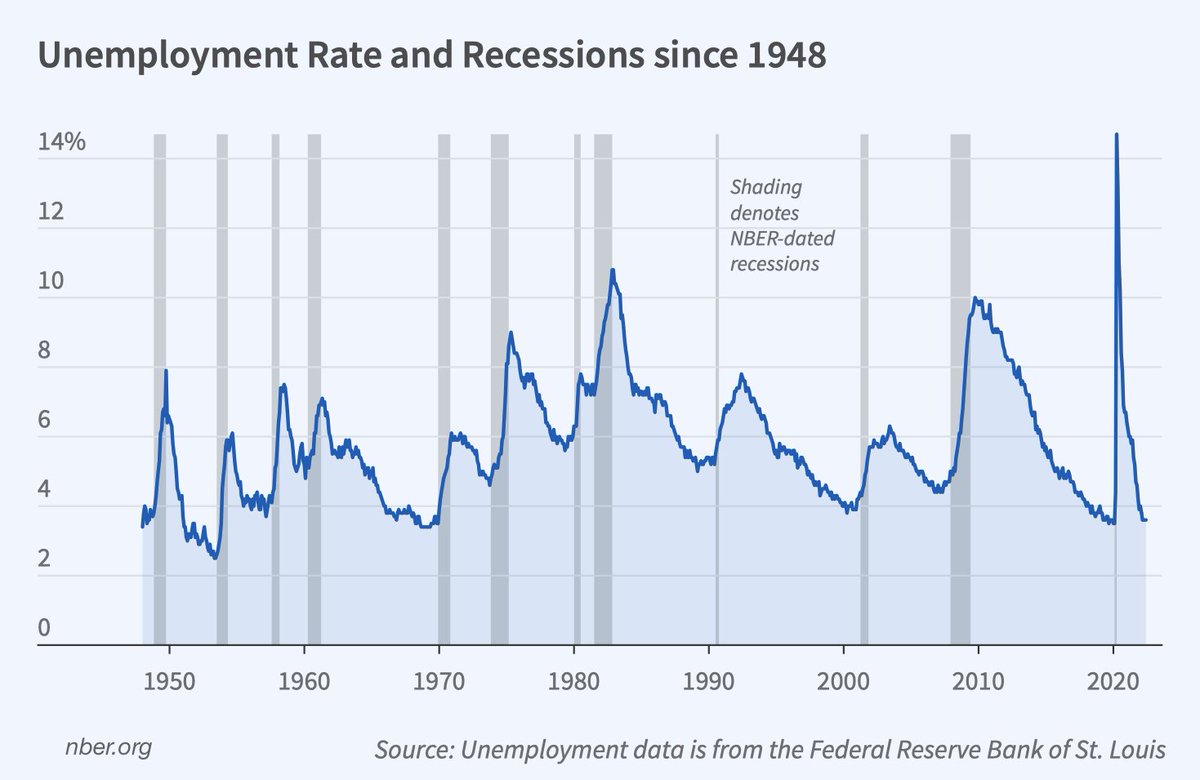
So, the next time you hear someone say, we’re at full employment, there must not be a recession coming anytime soon, show them this last chart
And be sure to point out the 70’s, 80’s and that lovely dagger of 2008.
And be sure to point out the 70’s, 80’s and that lovely dagger of 2008.
They kind of remind me of this chart, actually
Like flying a plane straight up into the atmosphere, just to dive-bomb it back to earth again.
Like flying a plane straight up into the atmosphere, just to dive-bomb it back to earth again.

Maybe that’s why Bloomberg’s own models say that there is a 100% chance of recession by the end of this year
You read that right: *100%*
You read that right: *100%*

🤔 How to Position Yourself
If you’ve been listening to me and reading my work, then you know how I’m personally positioned for the year ahead.
First, I’ve been buying metals and hard monies like #gold, #silver and #Bitcoin, and continue to add to them opportunistically.
If you’ve been listening to me and reading my work, then you know how I’m personally positioned for the year ahead.
First, I’ve been buying metals and hard monies like #gold, #silver and #Bitcoin, and continue to add to them opportunistically.
I also hold v short term USTs and a high allocation to FDIC-insured money markets, in order to keep plenty of dry powder, at the ready
So, I can pounce when the time is right
Because I agree with Bloomberg’s models and I’m anticipating the inevitable...
So, I can pounce when the time is right
Because I agree with Bloomberg’s models and I’m anticipating the inevitable...
Either we get some sort of credit event (like another run on regional banks, or worse) that causes a major market disruption and selloff, or we do in fact get the dreaded reality of a full-on recession
Or should we call it…
a banana. 🍌
Or should we call it…
a banana. 🍌
This thread is a summary of a recent Informationist Newsletter. If you enjoyed it, make sure to:
1. Follow @jameslavish to see more investment related content
2. Subscribe to The Informationist to learn one simplified concept weekly: jameslavish.substack.com
1. Follow @jameslavish to see more investment related content
2. Subscribe to The Informationist to learn one simplified concept weekly: jameslavish.substack.com
• • •
Missing some Tweet in this thread? You can try to
force a refresh


