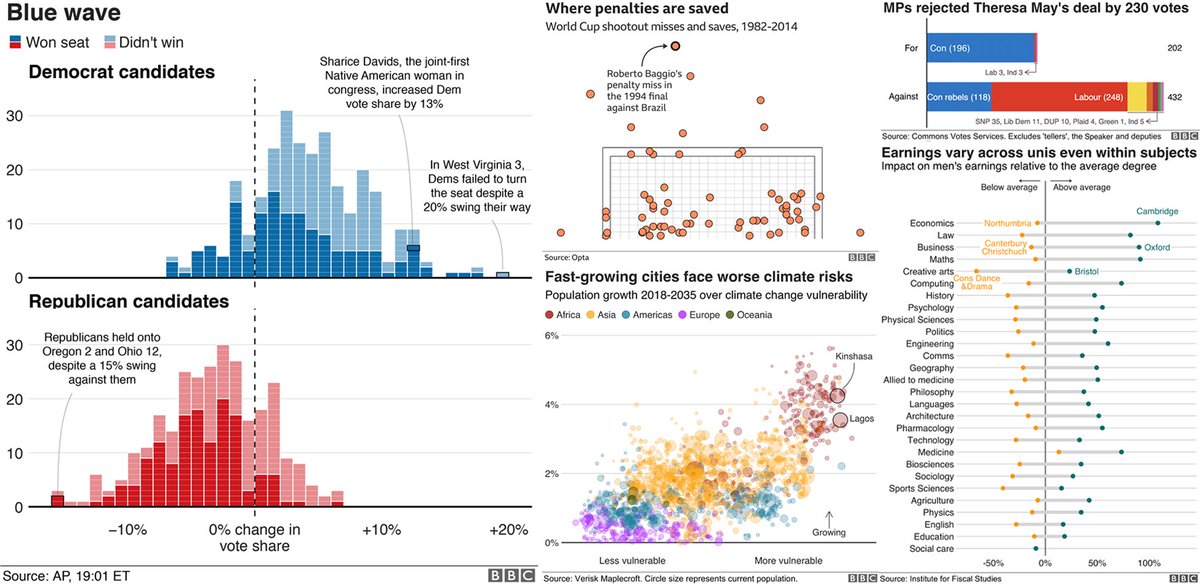
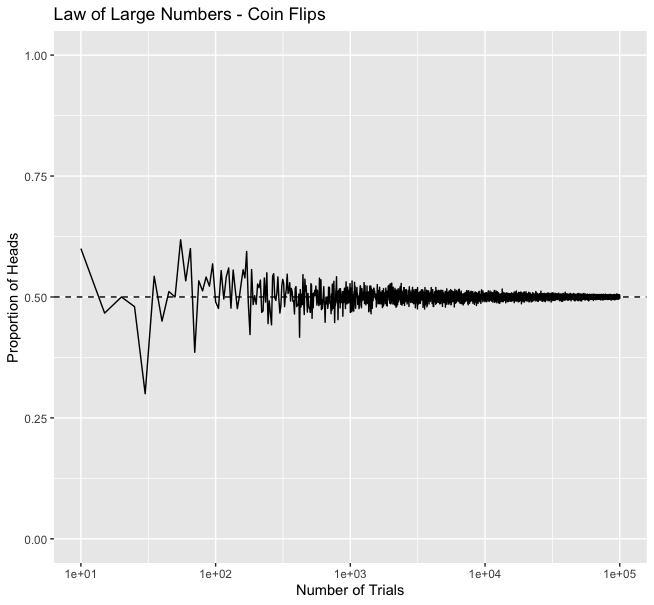
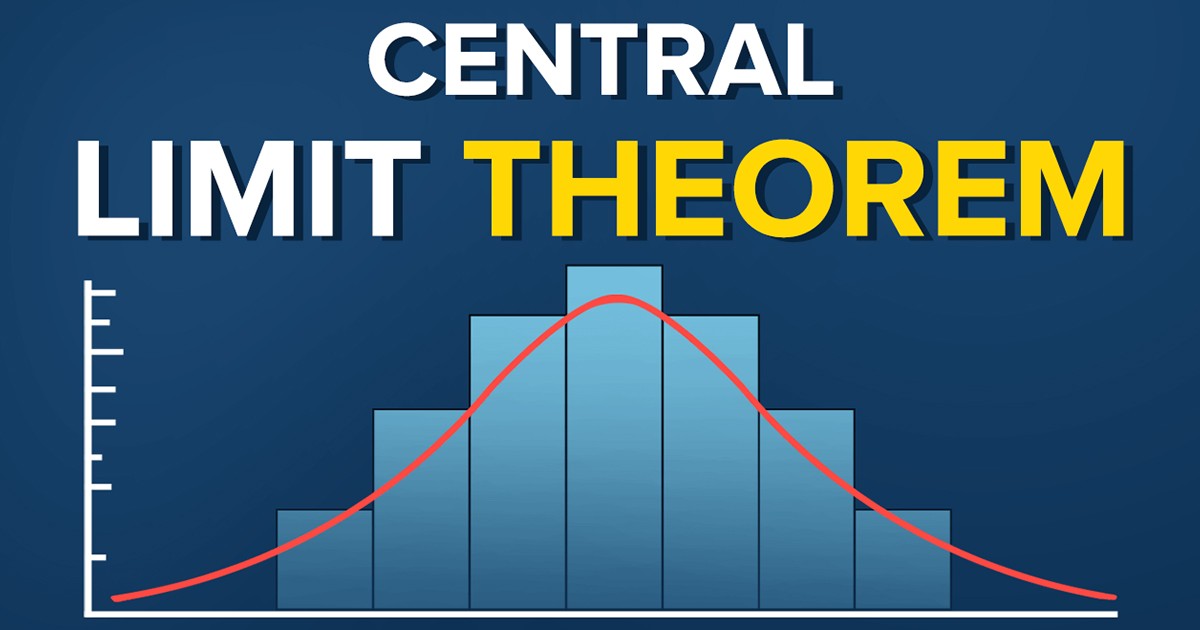
1/ 📊 Advanced Data Visualization in R: ggplot2 and Beyond 🎨 Take your data storytelling to the next level! In this thread, we'll explore advanced techniques for creating beautiful, informative, and interactive visualizations in R. #rstats #AdvancedR #DataViz #DataScience 

2/ 🎨 ggplot2: Enhance your ggplot2 graphics with:
•Custom themes and color palettes
•Faceting for small multiples
•Adding annotations and labels with ggrepel
•Incorporating custom geoms and stats
•ggplotly for interactive ggplot2 graphs
#Rstats #DataScience #DataViz
•Custom themes and color palettes
•Faceting for small multiples
•Adding annotations and labels with ggrepel
•Incorporating custom geoms and stats
•ggplotly for interactive ggplot2 graphs
#Rstats #DataScience #DataViz
3/ 🌐 Interactive Visualization: Create engaging, interactive visuals using:
•plotly for interactive charts and graphs
•highcharter for Highcharts-based visualizations
•leaflet for interactive maps
•dygraphs for time series data
#Rstats #DataScience #DataViz #AdvancedR
•plotly for interactive charts and graphs
•highcharter for Highcharts-based visualizations
•leaflet for interactive maps
•dygraphs for time series data
#Rstats #DataScience #DataViz #AdvancedR
4/ 📈 Specialized Visualization Packages: Cater to specific visualization needs with:
•ggmap for geospatial data and map integration
•ggraph for network graphs and tree structures
•ggforce for additional geoms, stats, and more
•gganimate for animated plots
#RStats
•ggmap for geospatial data and map integration
•ggraph for network graphs and tree structures
•ggforce for additional geoms, stats, and more
•gganimate for animated plots
#RStats
5/ 🎛️ Dashboarding: Build interactive, web-based dashboards using:
•Shiny for creating reactive web applications
•flexdashboard for easy-to-build static dashboards
•shinydashboard for a polished, responsive layout
#RStats #DataScience #DataViz #AdvancedR
•Shiny for creating reactive web applications
•flexdashboard for easy-to-build static dashboards
•shinydashboard for a polished, responsive layout
#RStats #DataScience #DataViz #AdvancedR
6/ 🎨 Custom Visualizations: Create your own visualization tools and packages by:
•Extending ggplot2 with custom geoms and stats
•Developing HTML widgets for interactive content
•Leveraging JavaScript libraries like D3.js
#RStats #DataScience #DataViz #AdvancedR
•Extending ggplot2 with custom geoms and stats
•Developing HTML widgets for interactive content
•Leveraging JavaScript libraries like D3.js
#RStats #DataScience #DataViz #AdvancedR
7/ 📚 Resources: Check out these books and chapters to learn more about advanced data viz in R:
•"Data Visualization with ggplot2" by Hadley Wickham
•"Interactive Data Visualization for the Web" by Scott Murray
•"Data Visualization: A Practical Introduction" by Kieran Healy
•"Data Visualization with ggplot2" by Hadley Wickham
•"Interactive Data Visualization for the Web" by Scott Murray
•"Data Visualization: A Practical Introduction" by Kieran Healy
8/ 🎉 In conclusion, advanced data visualization techniques in R can help you create stunning, informative, and interactive graphics. Explore these methods to elevate your data storytelling skills and bring your visualizations to life! #rstats #AdvancedR #DataViz #DataScience
• • •
Missing some Tweet in this thread? You can try to
force a refresh
 Read on Twitter


