[1/9] 🎲 Let's talk about the difference between probability and likelihood in #statistics. These two terms are often confused, but understanding their distinction is key for making sense of data analysis! #Rstats#DataScience
[2/9]💡Probability is a measure of how likely a specific outcome is in a random process. It quantifies the degree of certainty we have about the occurrence of an event. It ranges from 0 (impossible) to 1 (certain). The sum of probabilities for all possible outcomes is always 1.
[3/9] 📊 Likelihood, on the other hand, is a measure of how probable a particular set of observed data is, given a specific set of parameters for a statistical model. Likelihood is not a probability, but it shares the same mathematical properties (i.e., it's always non-negative).
[4/9] 🔑 The key difference between probability and likelihood is their focus. Probability is concerned with the outcome before it happens, while likelihood is focused on the model's parameters after the data has been observed. #RStats#DataScience
[5/9] 🌟 Now let's demonstrate the difference using #Rstats. Suppose we're interested in the probability of getting heads (H) or tails (T) when flipping a fair coin. We can simulate this process in R:
[6/9] 📈 From the simulation, we can estimate the probability of heads or tails. In this case, since it's a fair coin, the probability of each outcome is 0.5.
Now, let's consider a model with a parameter p (probability of heads) and compute the likelihood for the observed data.
[7/9] 🧮 In R, we can compute the likelihood using the binomial distribution:
[8/9] 📉 The likelihood plot shows how probable our observed data is for each value of p. The higher the likelihood, the more consistent the data is with the model parameters. Note that the likelihood isn't a probability distribution, as the area under the curve doesn't sum to 1.
[9/9] 📚It's important to remember that likelihood is not the probability of the parameters themselves, but rather a measure of how well those parameters fit the data we've observed. This distinction is crucial for understanding concepts like maximum likelihood estimation (MLE).
• • •
Missing some Tweet in this thread? You can try to
force a refresh
1/ 🎯 Introduction 📌
The #caret package in #R is a powerful tool for data pre-processing, feature selection, and machine learning model training. In this thread, we'll explore some useful tips & tricks to help you get the most out of caret. #DataScience#MachineLearning#RStats
2/ 🧹 Data Pre-processing 📌
caret offers various data pre-processing techniques, like centering, scaling, and removing near-zero-variance predictors. Use the preProcess() function to apply these methods before model training.🧪 #RStats#DataScience
3/ ⚙️ Feature Selection 📌
Use the rfe() function for recursive feature elimination. This method helps you find the most important features in your dataset, improving model performance & interpretation.🌟 #RStats#DataScience
1/🧶📝 Welcome to a Twitter thread discussing the pros & cons of the #R packages, #knitr and #sweave. These packages allow us to create dynamic, reproducible documents that integrate text, code, and results. Let's dive into the strengths and weaknesses of each. #Rstats
2/🔍 #knitr is a more recent and widely-used package that simplifies the creation of dynamic reports. It's an evolution of #sweave and supports various output formats, including PDF, HTML, and Word. Plus, it's compatible with Markdown and LaTeX! #Rstats
3/🌟 Pros of #knitr:
✅ Better syntax highlighting
✅ Cache system to speed up compilation
✅ Inline code chunks
✅ Flexible output hooks
✅ More output formats
✅ Integrates with other languages
Overall, it provides more control and customization in document creation. #RStats
🧵1/9 Let's talk about methods for identifying the optimal number of clusters in cluster analysis!
Cluster analysis is a technique used to group data points based on their similarity. Here are some popular methods & R packages. #RStats#DataScience
🔍2/9 Elbow Method: The Elbow Method involves plotting the explained variation (inertia) as a function of the number of clusters. The "elbow point" on the curve represents the optimal number of clusters. R package: 'factoextra' #RStats#DataSciencecran.r-project.org/web/packages/f…
📈3/9 Silhouette Score: This method evaluates the quality of clustering by calculating the average silhouette score of each data point. Higher silhouette scores indicate better cluster assignments. Optimal clusters have the highest average silhouette score.cran.r-project.org/web/packages/c…
🧵1/7 Understanding the difference between test set and validation set is crucial for building accurate and robust machine learning models. In this thread, we'll discuss the key differences between these two sets and their importance in model development. #MachineLearning#RStats
🧵2/7 Validation set: It is used during model development to tune hyperparameters and make decisions about the model architecture. It helps evaluate the model's performance and prevents overfitting by providing an unbiased estimate of how well the model generalizes to new data.
🧵3/7 Test set: This is a separate dataset not used during model training or validation. It's only used after the model has been finalized to assess its performance on completely unseen data. This provides an unbiased evaluation of the final model. #RStats#DataScience
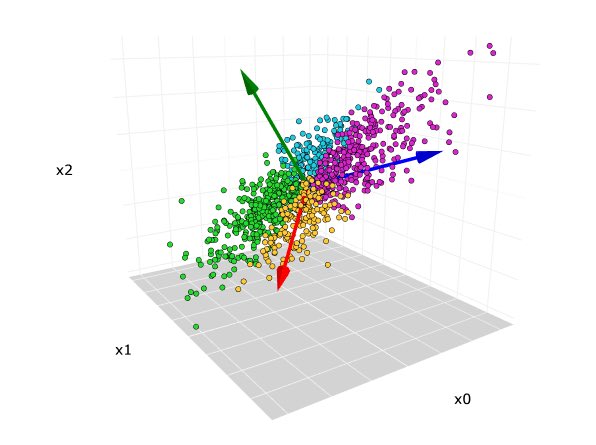
1/🧵🔍 Making sense of Principal Component Analysis (PCA), Eigenvectors & Eigenvalues: A simple guide to understanding PCA and its implementation in R! Follow this thread to learn more! #RStats#DataScience#PCA
2/📚PCA is a dimensionality reduction technique that helps us to find patterns in high-dimensional data by projecting it onto a lower-dimensional space. It's often used for data visualization, noise filtering, & finding variables that explain the most variance. #DataScience
3/🎯 The goal of PCA is to identify linear combinations of original variables (principal components) that capture the maximum variance in the data, with each principal component being orthogonal to the others. #RStats#DataScience