🧵1/7 Understanding the difference between test set and validation set is crucial for building accurate and robust machine learning models. In this thread, we'll discuss the key differences between these two sets and their importance in model development. #MachineLearning #RStats 

🧵2/7 Validation set: It is used during model development to tune hyperparameters and make decisions about the model architecture. It helps evaluate the model's performance and prevents overfitting by providing an unbiased estimate of how well the model generalizes to new data.
🧵3/7 Test set: This is a separate dataset not used during model training or validation. It's only used after the model has been finalized to assess its performance on completely unseen data. This provides an unbiased evaluation of the final model. #RStats #DataScience
🧵4/7 Differences:
🔹Purpose: Validate set fine-tunes model, test set for final assessment.
🔹Usage: Validate set in model dev stage, test set used post-finalization.
🔹Impact: Validate set directly affects model, test set doesn't impact. #RStats #DataScience
🔹Purpose: Validate set fine-tunes model, test set for final assessment.
🔹Usage: Validate set in model dev stage, test set used post-finalization.
🔹Impact: Validate set directly affects model, test set doesn't impact. #RStats #DataScience
🧵5/7 It's important to maintain the independence between these sets. Repeatedly using the test set to make model adjustments can lead to overfitting, as the model will start to perform well on the test set specifically, but may not generalize well to new data. #RStats
🧵6/7 In practice, data is often split into three parts: training, validation, and test sets. The training set is for model learning, the validation set for hyperparameter tuning, and the test set for final evaluation. This ensures unbiased model assessment. #DataScience #RStats
🧵7/7 To sum up, understanding the distinction between test and validation sets is crucial for building effective and generalizable machine learning models. They serve different purposes in the model development process, and maintaining their independence is key. #DataScience🤖🎓
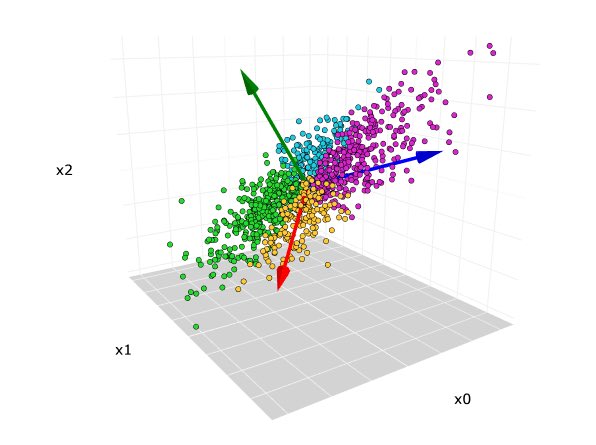
Let's demonstrate the process of splitting the data into training, validation, and test sets using R. We'll use the iris dataset, which is built into R, for this example.
1. First, let's load the necessary libraries and the iris dataset:
library(dplyr)
data(iris)
#RStats
1. First, let's load the necessary libraries and the iris dataset:
library(dplyr)
data(iris)
#RStats
2. Now, let's shuffle the dataset and split it into training, validation, and test sets (60%, 20%, and 20% respectively):
set.seed(42) # Set a seed for reproducibility
iris_shuffled <- iris %>% sample_frac(1)
#RStats
set.seed(42) # Set a seed for reproducibility
iris_shuffled <- iris %>% sample_frac(1)
#RStats
# Define the sizes of the data splits
train_size <- 0.6 * nrow(iris_shuffled)
validation_size <- 0.2 * nrow(iris_shuffled)
#RStats #DataScience
train_size <- 0.6 * nrow(iris_shuffled)
validation_size <- 0.2 * nrow(iris_shuffled)
#RStats #DataScience
# Split the data
train_data <- iris_shuffled[1:train_size,]
validation_data <- iris_shuffled[(train_size+1):(train_size+validation_size),]
test_data <- iris_shuffled[(train_size+validation_size+1):nrow(iris_shuffled),]
#RStats #DataScience
train_data <- iris_shuffled[1:train_size,]
validation_data <- iris_shuffled[(train_size+1):(train_size+validation_size),]
test_data <- iris_shuffled[(train_size+validation_size+1):nrow(iris_shuffled),]
#RStats #DataScience
3. Now you can train a model using the training set and tune its hyperparameters using the validation set. For instance, let's train a simple k-Nearest Neighbors (kNN) classifier using the class library:
library(class)
k_values <- c(1, 3, 5, 7, 9) # Define a range of k values for tuning
best_k <- k_values[1]
best_accuracy <- 0
#RStats #DataScience
k_values <- c(1, 3, 5, 7, 9) # Define a range of k values for tuning
best_k <- k_values[1]
best_accuracy <- 0
#RStats #DataScience
# Loop through the k values and evaluate the model on the validation set
for (k in k_values) {
predicted_labels <- knn(train_data[, -5], validation_data[, -5], train_data[, 5], k = k)
accuracy <- sum(predicted_labels == validation_data[, 5]) / nrow(validation_data)
#RStats
for (k in k_values) {
predicted_labels <- knn(train_data[, -5], validation_data[, -5], train_data[, 5], k = k)
accuracy <- sum(predicted_labels == validation_data[, 5]) / nrow(validation_data)
#RStats
cat("k =", k, ", accuracy =", accuracy, "\n")
if (accuracy > best_accuracy) {
best_accuracy <- accuracy
best_k <- k
}}
cat("Best k =", best_k, ", Best accuracy =", best_accuracy, "\n")
#RStats #DataScience
if (accuracy > best_accuracy) {
best_accuracy <- accuracy
best_k <- k
}}
cat("Best k =", best_k, ", Best accuracy =", best_accuracy, "\n")
#RStats #DataScience
4. Finally, evaluate the model on the test set:
test_predicted_labels <- knn(train_data[, -5], test_data[, -5], train_data[, 5], k = best_k)
test_accuracy <- sum(test_predicted_labels == test_data[, 5]) / nrow(test_data)
cat("Test accuracy =", test_accuracy, "\n")
#RStats
test_predicted_labels <- knn(train_data[, -5], test_data[, -5], train_data[, 5], k = best_k)
test_accuracy <- sum(test_predicted_labels == test_data[, 5]) / nrow(test_data)
cat("Test accuracy =", test_accuracy, "\n")
#RStats
In this example, we demonstrated how to split the data into training, validation, and test sets using R, and how to train a kNN model using the training set, tune its hyperparameters using the validation set, and evaluate its performance on the test set. #RStats #DataScience
• • •
Missing some Tweet in this thread? You can try to
force a refresh