Nakamoto Portfolio Theory
-----------------------------
Bitcoin Valuation based on Fixed Income
Inspired by @FossGregfoss's work, we'll explore how to estimate the value of Bitcoin using credit default swaps (CDS) as fiat insurance.
You know... "for the kids".
1/n
-----------------------------
Bitcoin Valuation based on Fixed Income
Inspired by @FossGregfoss's work, we'll explore how to estimate the value of Bitcoin using credit default swaps (CDS) as fiat insurance.
You know... "for the kids".
1/n

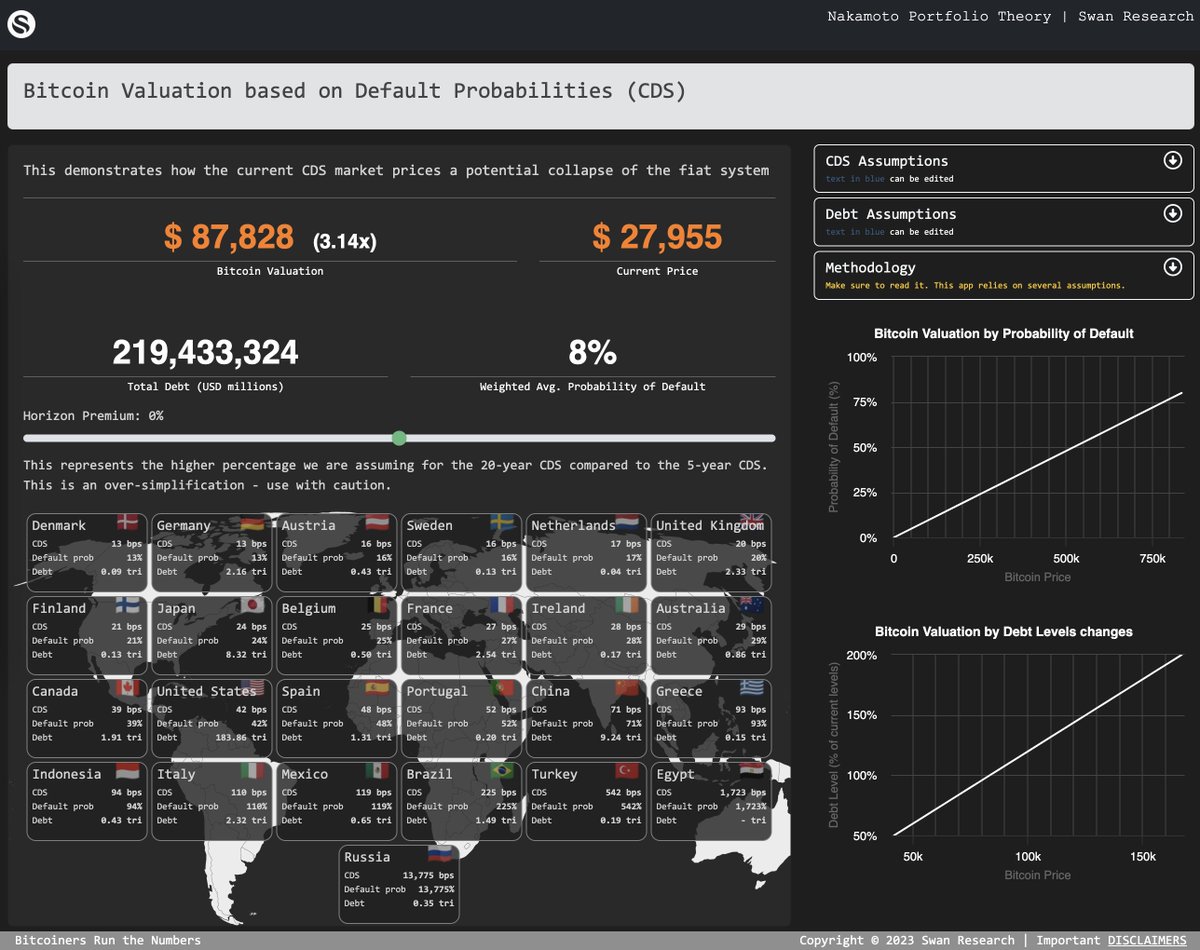
In line with our other research pieces, this one comes with a web app so you can also run the numbers.
In this one you can change pretty much all assumptions (numbers in blue can be edited) including CDS levels, debt levels and other assumptions.
nakamotoportfolio.com/apps/foss
2/n
In this one you can change pretty much all assumptions (numbers in blue can be edited) including CDS levels, debt levels and other assumptions.
nakamotoportfolio.com/apps/foss
2/n

Just like in our previous pieces, the idea is to give a framework to understand potential scenarios. Although I keep referring to them as models, these are frameworks. We provide some initial assumptions and you can create your own.
3/n
3/n

First, what is a CDS?
A Credit Default Swap (CDS) is a financial derivative that acts as insurance against the risk of a borrower defaulting on a loan. The buyer of the CDS pays a premium to the seller, who agrees to pay the face value of the loan if the borrower defaults.
4/n
A Credit Default Swap (CDS) is a financial derivative that acts as insurance against the risk of a borrower defaulting on a loan. The buyer of the CDS pays a premium to the seller, who agrees to pay the face value of the loan if the borrower defaults.
4/n
CDS can be used to estimate the probability of default by analyzing the CDS spread, which reflects the annual amount the buyer must pay the seller. A wider spread indicates a higher perceived risk of default.
#itsjustmath
5/n
#itsjustmath
5/n

Now, if we know the probability of a country defaulting, we can use that to calculate an insurance premium.
For example, if you drive a $10,000 car and you know that the probability of totaling that car is 1% / yr , you would be willing to pay $100 / yr in insurance.
6/n
For example, if you drive a $10,000 car and you know that the probability of totaling that car is 1% / yr , you would be willing to pay $100 / yr in insurance.
6/n
It works the same way here. If these countries default, their debt is "gone"... So we estimate the total value of this dollar premium by multiplying each country's probability of default by its debt plus unfunded liabilities,
estimated by OpenAI's GPT-4 (verify).
7/n
estimated by OpenAI's GPT-4 (verify).
7/n
Part 3.5 of @FossGregfoss paper provides an explanation of how to use CDS to value bitcoin. We made major adjustments that are listed at the app. Some are approximations. But the goal, again, is not to get to an exact price but rather understand potential outcomes.
8/n
8/n
Not surprising, the US is by far the one to watch. We got an estimate for US unfunded liabilities at 157tri (social security, medicaid, ...). Outside of the US the estimates are hard to find (I doubt China is only 500bi)
9/n
9/n

Now, these probabilities only price for a scenario of a HARD default. One where debt is just not paid.
But remember, many of these countries have large debts in their own currency. And you know what that means... brrrrrr...
10/n
But remember, many of these countries have large debts in their own currency. And you know what that means... brrrrrr...
10/n

Money printer equals soft default by inflation. A highly probable scenario not priced here. There's no default and yet, fiat dies a slow death (or not so slow).
11/n
11/n
In summary, this bitcoin Valuation model based on Default Probabilities (CDS) serves as a framework to understand potential outcomes and impacts on Bitcoin's valuation. Shoutout to @FossGregfoss for inspiring this analysis!
#LearnMath #forthekids
[EOT]
#LearnMath #forthekids
[EOT]
When @FossGregfoss model goes open source it becomes FOSS^2. It's just math.
github.com/pxsocs/nakamot…
github.com/pxsocs/nakamot…
• • •
Missing some Tweet in this thread? You can try to
force a refresh


