✅Time Series Forecasting explained in simple terms and how to use it ( with code).
A quick thread 🧵👇🏻
#Python #DataScience #MachineLearning #DataScientist #Programming #Coding #100DaysofCode #hubofml #deeplearning
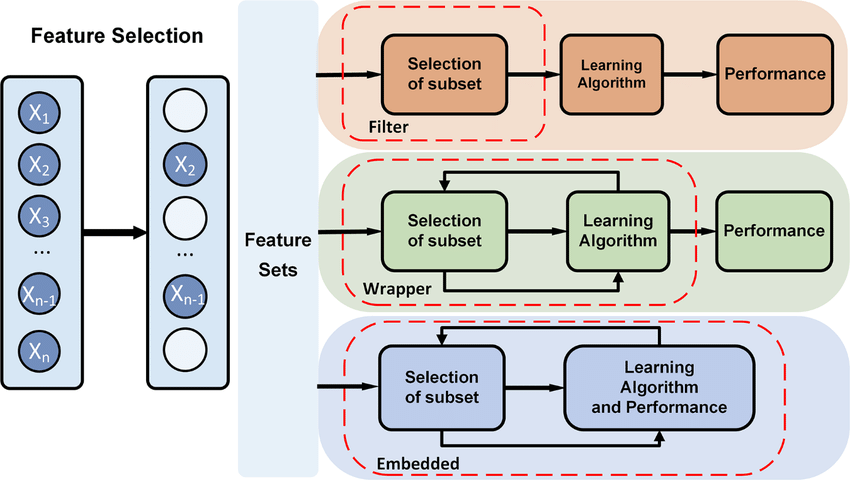
Pic credits : ResearchGate
A quick thread 🧵👇🏻
#Python #DataScience #MachineLearning #DataScientist #Programming #Coding #100DaysofCode #hubofml #deeplearning
Pic credits : ResearchGate

1/ Imagine you have a special notebook where you write down the temperature outside every day. You write down the temperature in the morning and also in the afternoon. Now, after a few months, you have a lot of temperature numbers in your notebook.
2/ Time series forecasting is like using magic to predict what the temperature might be in the future. You look at all the numbers you wrote down and try to find a pattern or a trend.
3/ Using this pattern, you can make a guess about what the temperature will be tomorrow or next week, even if you haven't written it down yet. Of course, it's not always perfect because weather can be tricky, but it helps you make an educated guess.
4/ Time series forecasting is a way to use the numbers you have from the past to make predictions about what might happen in the future. It's like having a crystal ball that can tell you what might come next based on what has already happened.
5/ Time series forecasting is a technique used to predict future values based on historical data. It involves analyzing a sequence of data points ordered over time. Use time series forecasting is to gain insights and make informed decisions based on future trends and patterns.
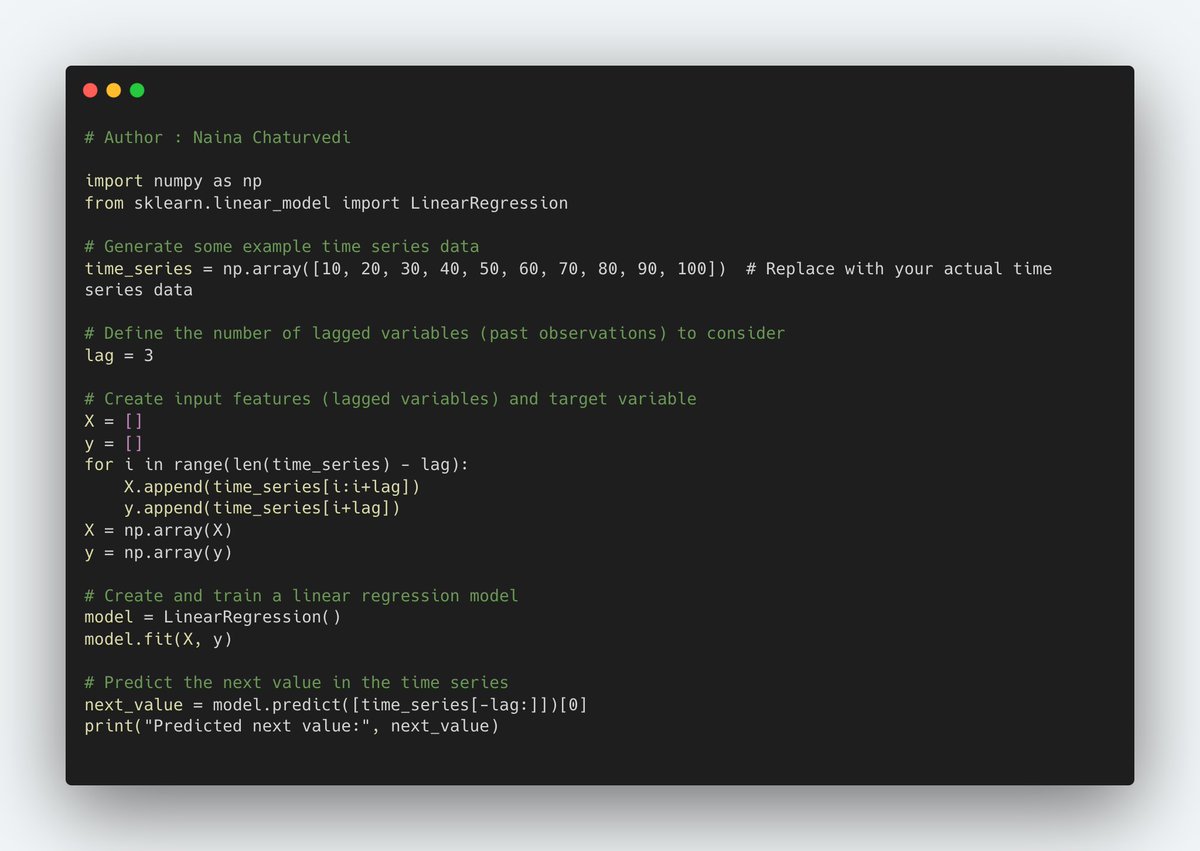
6/ Time Series Forecasting as Supervised Learning Implementation - Use a technique called "lagged variables." In this method, we use past observations of the time series data as input features to predict future values. 
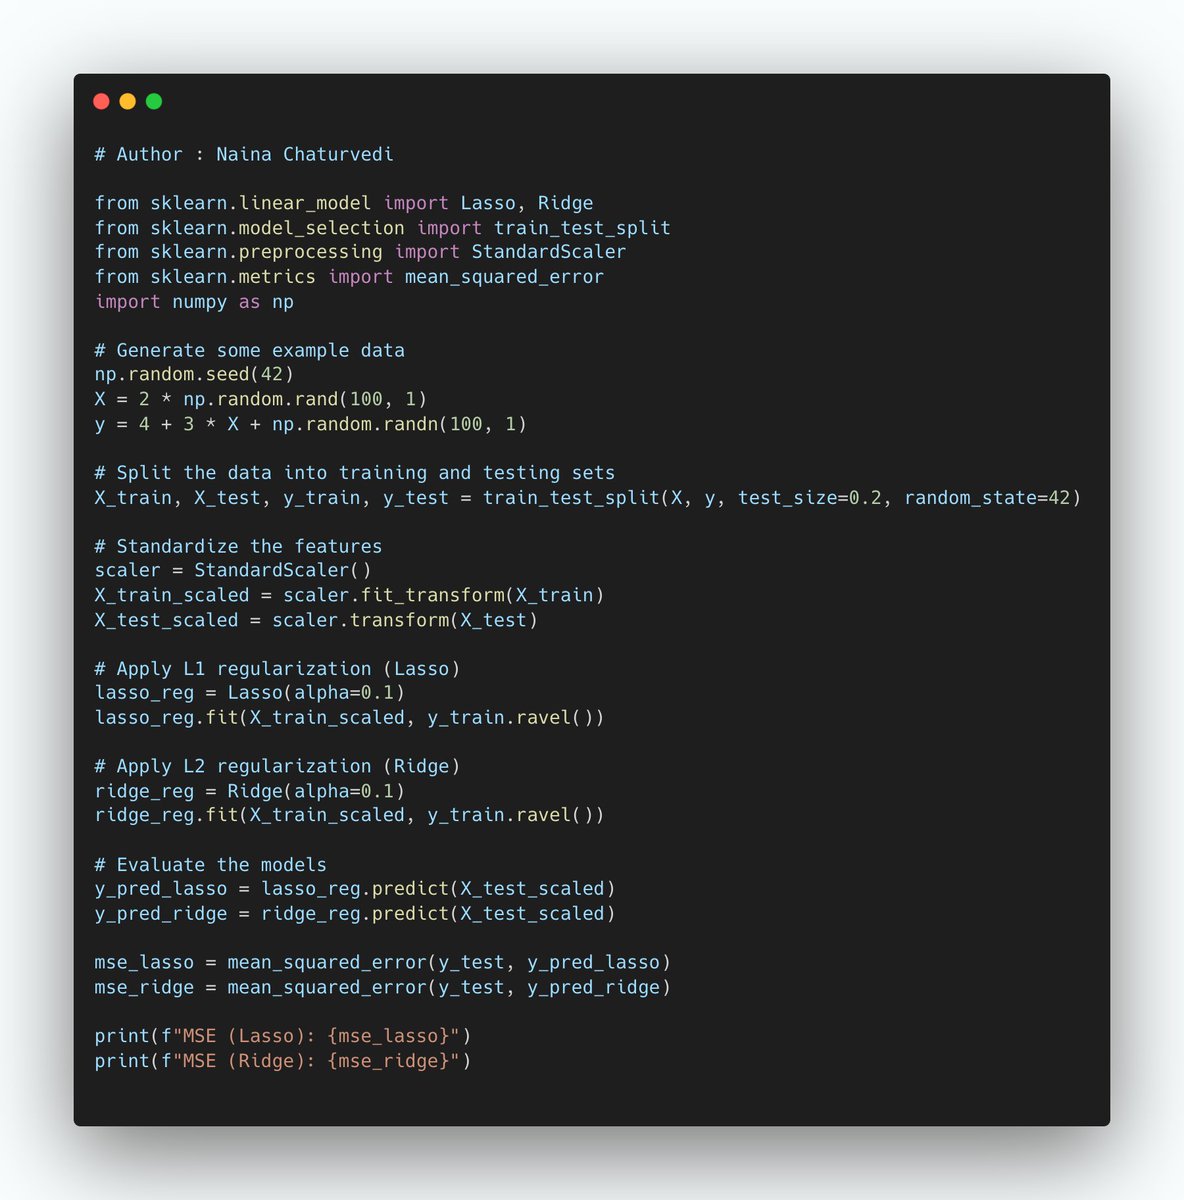
8/ Normalize and Standardize Time Series Data Implementation -
Normalization and standardization are common preprocessing techniques that help bring data to a similar scale, making it easier for machine learning models to learn from the data.
Normalization and standardization are common preprocessing techniques that help bring data to a similar scale, making it easier for machine learning models to learn from the data.

9/ Feature Engineering With Time Series Data Implementation -
Feature engineering is an essential step in working with time series data. It involves creating new features or transforming existing features to improve the performance of machine learning models.
Feature engineering is an essential step in working with time series data. It involves creating new features or transforming existing features to improve the performance of machine learning models.

10/ Baseline Predictions for Time Series Forecasting Implementation -
In time series forecasting, creating baseline predictions can serve as a simple benchmark to evaluate the performance of more sophisticated models.
In time series forecasting, creating baseline predictions can serve as a simple benchmark to evaluate the performance of more sophisticated models.

11/ ARIMA Model for Time Series Forecasting Implementation -
To create an ARIMA model for time series forecasting in Python, you can use the statsmodels library, which provides a comprehensive set of tools for time series analysis.
To create an ARIMA model for time series forecasting in Python, you can use the statsmodels library, which provides a comprehensive set of tools for time series analysis.

12/ Grid Search ARIMA Model Hyperparameters Implementation -
Grid searching ARIMA model hyperparameters involves searching over a range of values for the AR, I, and MA terms to find the combination that yields the best model performance.
Grid searching ARIMA model hyperparameters involves searching over a range of values for the AR, I, and MA terms to find the combination that yields the best model performance.

13/ Persistence Forecast Model Implementation -
The persistence forecast model is a simple baseline model that assumes the future value of a time series will be the same as the most recent observed value.
The persistence forecast model is a simple baseline model that assumes the future value of a time series will be the same as the most recent observed value.

14/ Autoregressive Forecast Model Implementation -
To implement an Autoregressive (AR) forecast model using Python, you can utilize the statsmodels library. The AR model uses past values of the time series to predict future values.
To implement an Autoregressive (AR) forecast model using Python, you can utilize the statsmodels library. The AR model uses past values of the time series to predict future values.

15/ Implementing Transfer Function Models (also known as input-output models) in Python requires identifying the appropriate input and output variables, estimating the model parameters, and performing predictions. 

16/ Implementing Intervention Analysis and Outlier Detection in Python typically involves identifying and analyzing sudden shifts or anomalies in the time series data. 

17/ Time Series Models with Heteroscedasticity - To model time series data with heteroscedasticity (varying levels of volatility), one popular approach is to use the Generalized Autoregressive Conditional Heteroscedasticity (GARCH) model. 

18/ Segmented Time Series Modeling and Forecasting -
Segmented Time Series Modeling and Forecasting involves dividing a time series into segments based on specific criteria and building separate models for each segment.
Segmented Time Series Modeling and Forecasting involves dividing a time series into segments based on specific criteria and building separate models for each segment.

19/ Nonlinear Time Series Models Implmentation -
Implementing Nonlinear Time Series Models in Python involves using appropriate nonlinear models such as the Nonlinear Autoregressive Exogenous (NARX) model.
Implementing Nonlinear Time Series Models in Python involves using appropriate nonlinear models such as the Nonlinear Autoregressive Exogenous (NARX) model.

• • •
Missing some Tweet in this thread? You can try to
force a refresh


