✅Model Evaluation in Machine Learning - Explained in simple terms with implementation details (code, techniques and best tips).
A quick thread 📷
#MachineLearning #DataScientist #Coding #100DaysofCode #hubofml #deeplearning #DataScience
PC : ResearchGate
A quick thread 📷
#MachineLearning #DataScientist #Coding #100DaysofCode #hubofml #deeplearning #DataScience
PC : ResearchGate

1/ Imagine you're baking cookies. You follow a recipe, put all the ingredients together, and then you bake them in the oven. But how do you know if your cookies turned out delicious? You taste them, right?
2/ In ML, Models are like smart helpers that can do things like tell you what's in a picture or predict tomorrow's weather. We train these models using lots of data, just like you learn from lots of experiences.
3/ We use model evaluation to see how well our model learned. We give it new examples that it hasn't seen before and see if it can give the right answers.
4/ Model evaluation in ML is the process of assessing how well a trained model performs on new, unseen data. It involves using various evaluation metrics to measure the model's predictive accuracy, generalization capability, and its ability to capture patterns in the data.
5/ Model evaluation helps determine whether the model is suitable for deployment, provides insights into its strengths and weaknesses, and guides the selection of appropriate hyperparameters and algorithms.

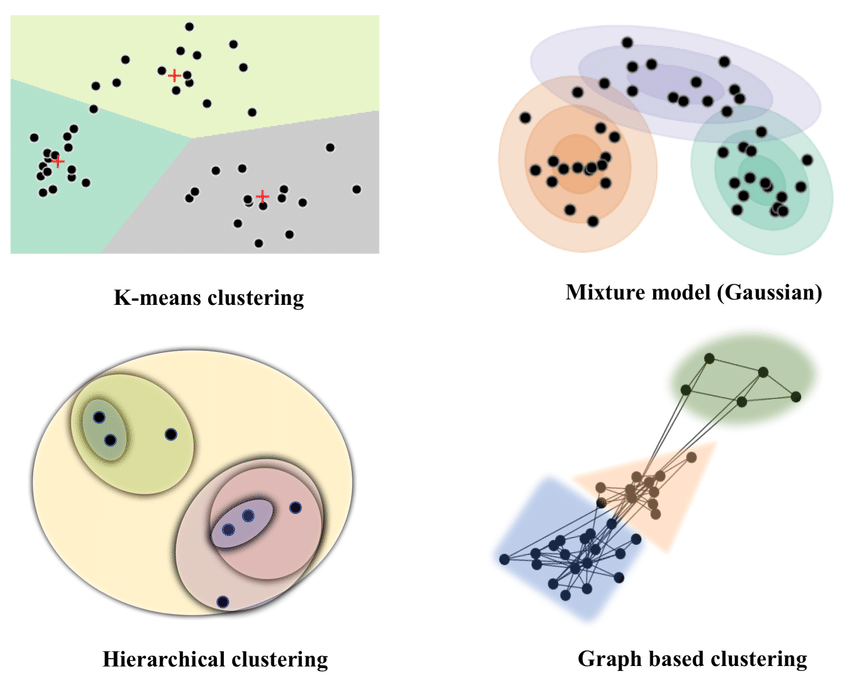
6/ Classification Metrics:
When we're working on problems where we want the model to make choices, like deciding if an email is spam or not, or identifying whether a picture has a cat or a dog, we use classification metrics to see how well the model is doing.
When we're working on problems where we want the model to make choices, like deciding if an email is spam or not, or identifying whether a picture has a cat or a dog, we use classification metrics to see how well the model is doing.
7/ Accuracy: It's like counting how many of the model's guesses were correct out of all the guesses it made.
Precision: Imagine you only want to eat healthy snacks. Precision is like how many of the snacks you thought were healthy actually turned out to be healthy.
Precision: Imagine you only want to eat healthy snacks. Precision is like how many of the snacks you thought were healthy actually turned out to be healthy.
8/ Recall: This is like not missing any healthy snacks. It's about how many of actual healthy snacks you managed to catch.
F1-score: It's balance between precision and recall. It helps you see how well the model is at finding the right things and not missing important things.
F1-score: It's balance between precision and recall. It helps you see how well the model is at finding the right things and not missing important things.
9/ ROC-AUC: Think of this as how well the model can tell the difference between things. Like how well it can separate cats from dogs in pictures.

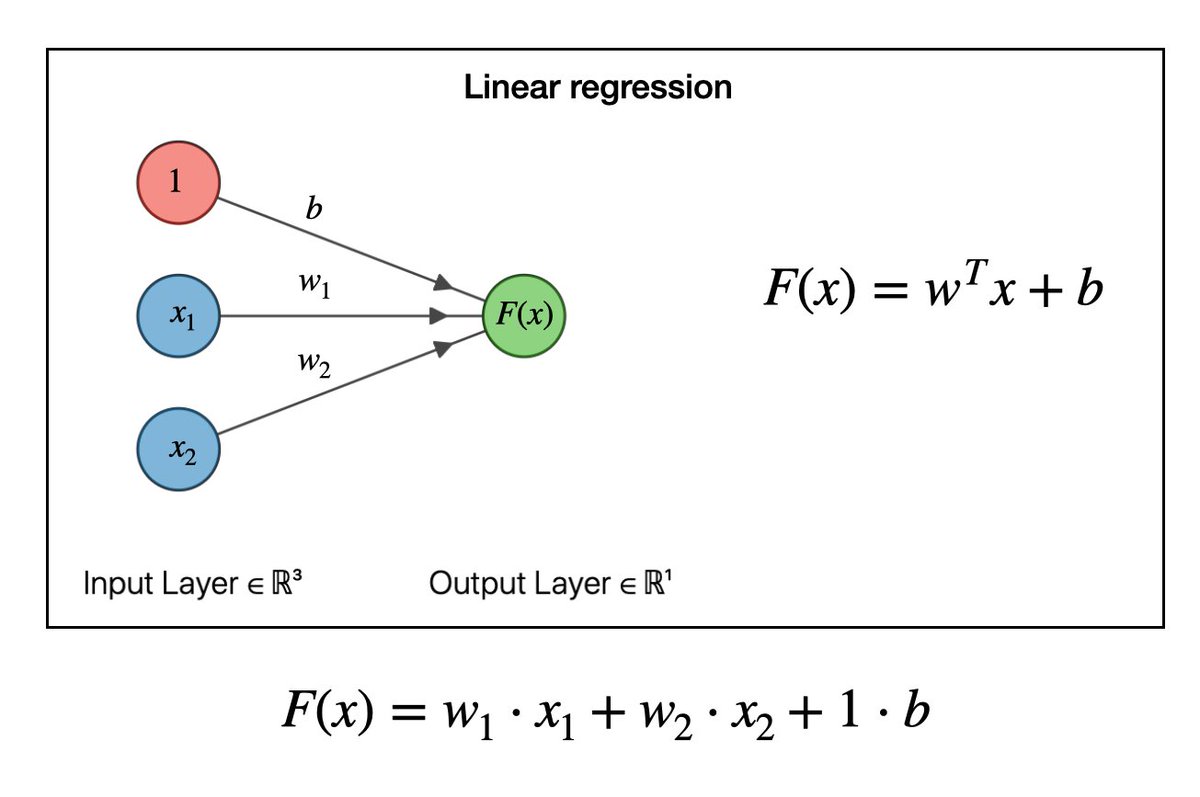
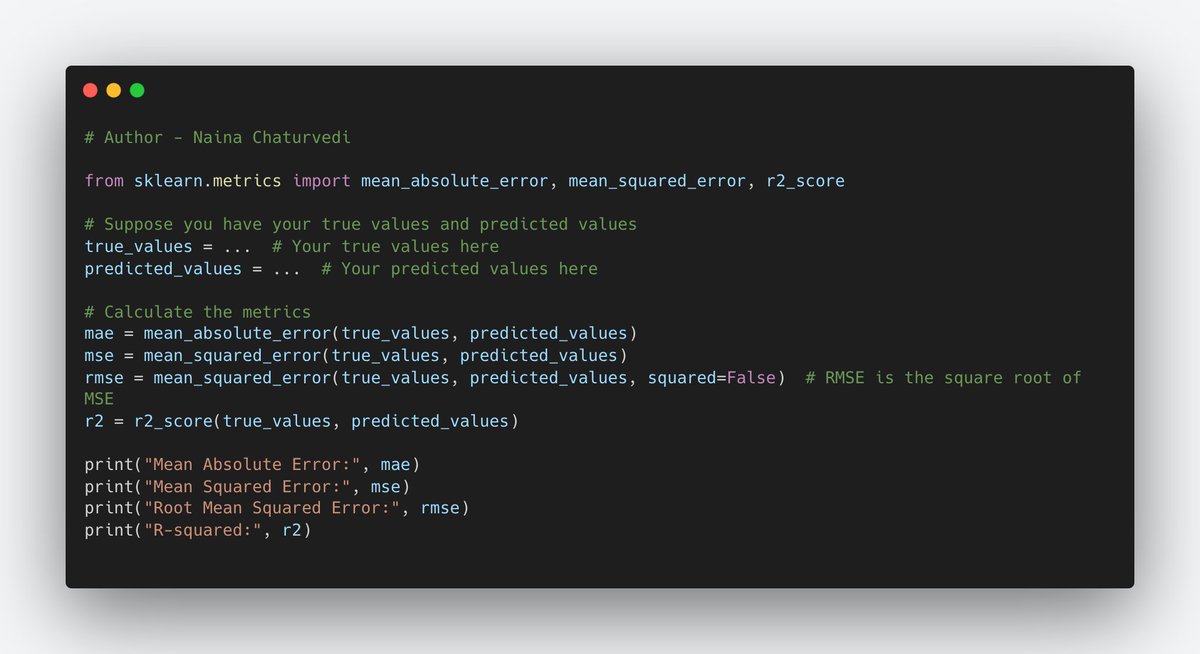
10/ Regression Metrics:
For problems where we're predicting numbers, like predicting the price of a house based on its features, we use regression metrics to see how well the model's predictions match the actual values.
For problems where we're predicting numbers, like predicting the price of a house based on its features, we use regression metrics to see how well the model's predictions match the actual values.
11/ Mean Absolute Error (MAE): It's like the average difference between your predictions and the actual values.
Mean Squared Error (MSE): This is like taking the average of the squared differences between your predictions and the actual values.
Mean Squared Error (MSE): This is like taking the average of the squared differences between your predictions and the actual values.
12/ Root Mean Squared Error (RMSE): This is the square root of the MSE. It's like an average of the "big" differences.
R-squared (R2): Think of this as how much of the variation in the actual values your model is able to explain.
R-squared (R2): Think of this as how much of the variation in the actual values your model is able to explain.
13/ Overfitting:
Overfitting happens when a model learns the training data so well that it starts memorizing it instead of understanding the real patterns. This can make the model perform poorly on new data it hasn't seen before.
Overfitting happens when a model learns the training data so well that it starts memorizing it instead of understanding the real patterns. This can make the model perform poorly on new data it hasn't seen before.
14/ Underfitting:
Underfitting occurs when the model is too simple to capture the important patterns in the data. It's like trying to fit a straight line to a curvy path – it won't match well.
Underfitting occurs when the model is too simple to capture the important patterns in the data. It's like trying to fit a straight line to a curvy path – it won't match well.

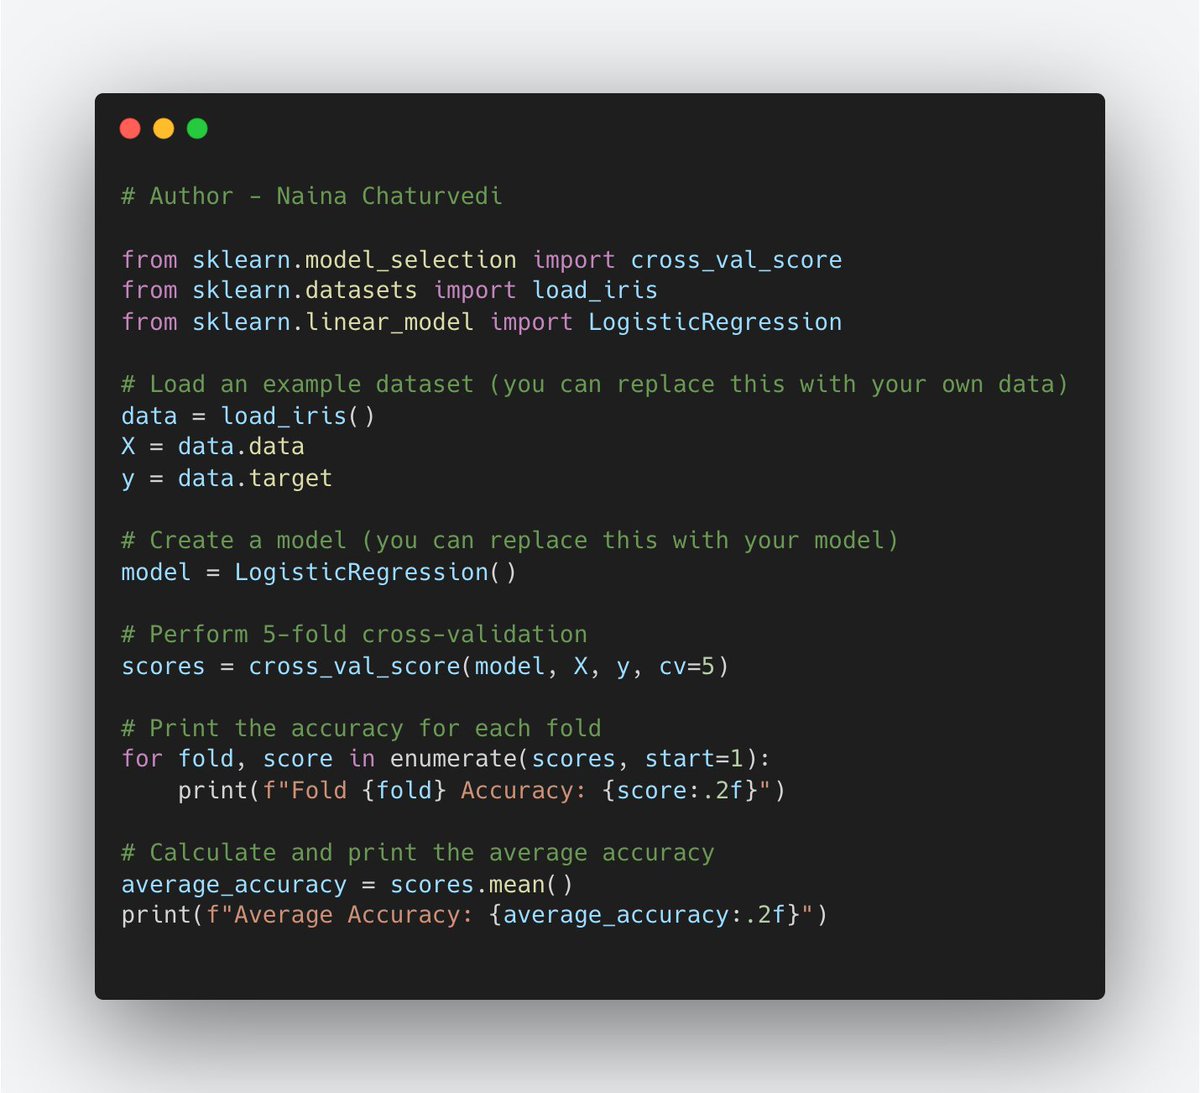
15/ Cross-Validation:
Cross-validation helps you avoid relying too much on just one set of data for training and testing. Instead, you split your data into smaller groups (folds), and you take turns using each group as a testing set while using the rest for training.
Cross-validation helps you avoid relying too much on just one set of data for training and testing. Instead, you split your data into smaller groups (folds), and you take turns using each group as a testing set while using the rest for training.
16/ Confusion Matrix:
A confusion matrix shows how many predictions your model got right and wrong for each class. It's a way to see the true positives , true negatives, false positives, and false negatives (predicted negatives that were actually positives).
A confusion matrix shows how many predictions your model got right and wrong for each class. It's a way to see the true positives , true negatives, false positives, and false negatives (predicted negatives that were actually positives).

17/ Precision: How many of the positive predictions were actually positive? It's like asking how many people you guessed were guilty were actually guilty.
18/ Recall: How many of the actual positives did you manage to predict as positive? Like asking how many guilty people you caught among all the guilty ones.
F1-score: It helps you understand how well your model is at finding the right things and not missing important things.
F1-score: It helps you understand how well your model is at finding the right things and not missing important things.

19/ ROC Curve:
An ROC curve helps you understand how well your binary classifier (a model that predicts two classes) is performing at different decision thresholds. It shows the trade-off between true positive rate and false positive rate (how often it makes false alarms).
An ROC curve helps you understand how well your binary classifier (a model that predicts two classes) is performing at different decision thresholds. It shows the trade-off between true positive rate and false positive rate (how often it makes false alarms).

20/ Area Under the ROC Curve (AUC-ROC):
It is a measure of how well your model is able to discriminate between the two classes. It tells you how well the model can tell the difference between positive and negative cases across all possible decision thresholds.
It is a measure of how well your model is able to discriminate between the two classes. It tells you how well the model can tell the difference between positive and negative cases across all possible decision thresholds.

21/ A higher AUC-ROC score indicates a better-performing model. If AUC-ROC is close to 0.5, the model is performing similar to random guessing. If AUC-ROC is close to 1, the model is doing a great job distinguishing between the classes.
22/ Feature Importance: Each feature (or ingredient) contributes to the model's predictions in different ways. Some features might be super important, while others might not matter as much. Understanding feature importance can help you focus on what really matters in your data.

23/ Bias and Fairness:
A machine learning model can be biased if it's making decisions that are unfair or unequal to different groups of people. Bias and fairness are important because we want to make sure our models treat everyone fairly, no matter who they are.
A machine learning model can be biased if it's making decisions that are unfair or unequal to different groups of people. Bias and fairness are important because we want to make sure our models treat everyone fairly, no matter who they are.
24/ Assessing Bias in Model Predictions:
One way to assess bias is by looking at distribution of predictions across different demographic groups. For instance, if a model is more likely to wrongly predict negative outcomes for one group than another, that could indicate bias.
One way to assess bias is by looking at distribution of predictions across different demographic groups. For instance, if a model is more likely to wrongly predict negative outcomes for one group than another, that could indicate bias.

25/ Ensemble Methods:
Ensemble methods help improve the performance and robustness of models by reducing individual model errors and increasing overall accuracy. They're like forming a team of models that work together to solve a problem.
Ensemble methods help improve the performance and robustness of models by reducing individual model errors and increasing overall accuracy. They're like forming a team of models that work together to solve a problem.
26/ Two common ensemble methods- Random Forest creates multiple decision trees and combines their outputs to make a more accurate prediction. Gradient Boosting builds trees one by one, where each new tree tries to correct the errors of the previous ones.

27/ Hyperparameter Tuning:
Hyperparameters are like are settings that you can adjust before training your model to improve its performance. Hyperparameter tuning helps you find the right combination of these settings to make your model work its best.
Hyperparameters are like are settings that you can adjust before training your model to improve its performance. Hyperparameter tuning helps you find the right combination of these settings to make your model work its best.
28/ Grid Search for Hyperparameter Tuning:
Grid search is a technique where you try out all possible combinations of hyperparameters from a predefined grid and find the one that works best.
Grid search is a technique where you try out all possible combinations of hyperparameters from a predefined grid and find the one that works best.

29/Regularization:
Regularization helps you focus on most important features while preventing model from becoming too complex.
Regularization techniques like L1 and L2 work by adding a penalty to model's cost function for having large coefficients (weights) on the features.
Regularization helps you focus on most important features while preventing model from becoming too complex.
Regularization techniques like L1 and L2 work by adding a penalty to model's cost function for having large coefficients (weights) on the features.
30/ L1 and L2 Regularization:
L1 and L2 regularization are two common techniques. L1 regularization (also called Lasso) adds the absolute values of the coefficients as a penalty, which tends to push some coefficients to exactly zero, effectively removing those features.
L1 and L2 regularization are two common techniques. L1 regularization (also called Lasso) adds the absolute values of the coefficients as a penalty, which tends to push some coefficients to exactly zero, effectively removing those features.

31/ SHAP (SHapley Additive exPlanations):
SHAP is a technique that helps explain individual predictions made by a model. It calculates the contribution of each feature to a prediction by considering all possible combinations of feature values.
SHAP is a technique that helps explain individual predictions made by a model. It calculates the contribution of each feature to a prediction by considering all possible combinations of feature values.

32/ Handling Imbalanced Data:
It cause your model to favor the majority class and perform poorly on the minority class. Techniques like oversampling (adding more instances of minority class), undersampling and using appropriate evaluation metrics can help address this issue.
It cause your model to favor the majority class and perform poorly on the minority class. Techniques like oversampling (adding more instances of minority class), undersampling and using appropriate evaluation metrics can help address this issue.
33/ Oversampling and Evaluation Metrics:
Oversampling involves adding more instances of the minority class to balance the class distribution. Appropriate evaluation metrics take into account the class imbalance and give more weight to the performance on the minority class.
Oversampling involves adding more instances of the minority class to balance the class distribution. Appropriate evaluation metrics take into account the class imbalance and give more weight to the performance on the minority class.

34/ Comparing Multiple Models:
To compare multiple models, you need to use the same evaluation metrics and the same dataset for each model. This helps you ensure a fair comparison and choose the model that provides the best results.
To compare multiple models, you need to use the same evaluation metrics and the same dataset for each model. This helps you ensure a fair comparison and choose the model that provides the best results.

35/ When and why to do model evaluation:
After Training: Once a model is trained, it's essential to evaluate its performance using data it hasn't seen before. This simulates how the model will behave in real-world scenarios.
After Training: Once a model is trained, it's essential to evaluate its performance using data it hasn't seen before. This simulates how the model will behave in real-world scenarios.
36/ Hyperparameter Tuning: During hyperparameter tuning, you need to evaluate different settings to find the optimal configuration that results in the best model performance.
37/ Model Selection: When choosing between multiple algorithms or architectures, model evaluation helps identify the one that provides the best balance between accuracy and generalization.
38/ Comparing Models: When you have multiple models addressing the same problem, evaluation metrics help compare their performance and select the most suitable one.
39/ Avoid Overfitting and Underfitting: Model evaluation reveals whether a model is overfitting (performing well on training data but poorly on new data) or underfitting (not capturing the data's patterns effectively).
• • •
Missing some Tweet in this thread? You can try to
force a refresh