

 As you can see a few states float to the top, but when you look at a population adjusted (adjusted for the 0-4yr old population), some float to the top.
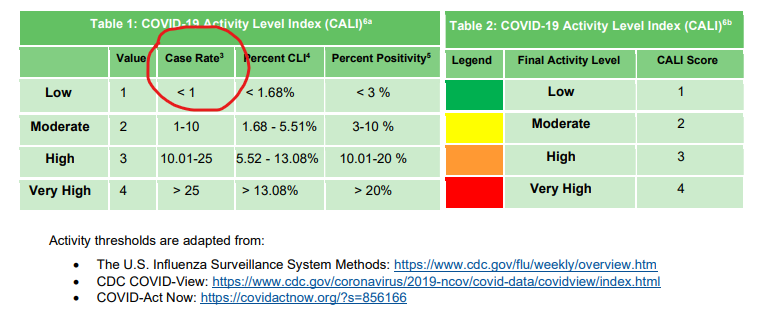 This metric was developed by the self avowed zerocovid nutters over at "Covid-Act Now" back 2 years ago, and was never changed despite not only the strategy shift away from "Covid zero is attainable", but was never adjusted for the significant increase in testing available
 We basically have more 80+ hospitalized (as a percent of the total hospitalized) than at any other time since the summer the pandemic started. Despite these people being the most protected and most vaccinated. This doesnt make sense.
 1 death from contacting a powered lawnmower. Covid death.


 Looking at reinfection alone, we aren't seeing much difference from the last look in, which under 2% of all cases being reinfection. This has been the case for the majority of the pandemic. Will be interesting to see this data once Omicron hits this area.

 Second, raw 7d avg Hospitalizations by age group. No surprises here, still being driven by older age groups. At the same case rate during the 2020 Winter wave, hospitals were slightly lower in most age groups.

 Source: fda.gov/media/153409/d…

 Jan 2019


 First, pediatric and 18-19 yr olds. There hasnt been an 18-19 yr old admitted with confirmed covid in quote some time, and none through our entire fall wave, yet we are mandating vaccines for college kids. Insane.