BlueCityBrain Profile picture
Manchester City is rent free in my brain💙👕I like data and sometimes like to make infographics
Dec 14 11 tweets 4 min read
Manchester City released their accounts for 2023/24 and recorded record revenue (again) and another year in the green lets take a look over the last few years Image In the latest accounts, Man City posted a £74m profit before tax, down slightly from £80m in the prior year but significantly improved compared to earlier losses, reflecting stable financial performance with a total of £76m total over the last 5 years Image
Sep 12 8 tweets 4 min read
Manchester United released their 2024 accounts so here is their accounts over the last 5 years Image To start off with Manchester United reported a before tax loss of £130.7m which is a total of 359m in losses accumulated over the last 5 seasons. Image
Aug 31 25 tweets 14 min read
2024/25 Summer window SLAMS SHUT (Simply Closes) and as always comes my mega thread detailing the window and comparing to the last 5 seasons with full team to team breakdowns

(Long thread) Image First lets start with the 2025 Net spend chart

Surprisingly Brighton end the window with the highest Net Spend of the 2024/25 Summer at £155m

This window saw a lot of the big teams have "quieter" windows with Liverpool, Arsenal and Man City (-£140m 🤯) all in negative Image
May 15 7 tweets 3 min read
On a "Net Spend" scale technically Pep is right

From 2017 to 2024 (since Peps time at the club) he has a lower netspend than Arsenal

With Citys netspend over the period coming to:
- £497m (Spend of £1.37bn)

While Arsenals comes to:
- £690m (spend of £1.05bn)
Image Since Artetas been at the club though from 2020/21 onwards it looks even better:

With City having a £87m netspend to Arsenals £465m

This is due to Citys exceptional selling over the period. Image
Apr 29 13 tweets 5 min read
All Premier League clubs have released their 2022/23 season financials so heres a 🧵on the finance comparison of Premier League teams on key metrics Image Premier League clubs earned a total of £6bn combined in total revenue streams a £500m increase from the previous season in 2021/22

As usual the "Big 6" absolutely dominate the top revenue earners with these 6 clubs making up near 60% with £3.5bn of that revenue Image
Sep 4, 2023 37 tweets 22 min read
Another window has come to a close and with that one of my mega threads detailing all transfer activity across the last 5 seasons including the 2023/24 Summer window! (LONG THREAD!!)

So Lets begin first with the 2023/24 Summer Window

Chelsea has the highest Netspend at £171m Image with United, Arsenal, Liverpool, Tottenham, Newcastle and SHOCK Bournemouth all cracking over £100m for the window.
The window saw the 2nd biggest spending spree in premier league history at £2.59bn spent.

(2023 Summer Overview) Image
Sep 2, 2022 26 tweets 14 min read
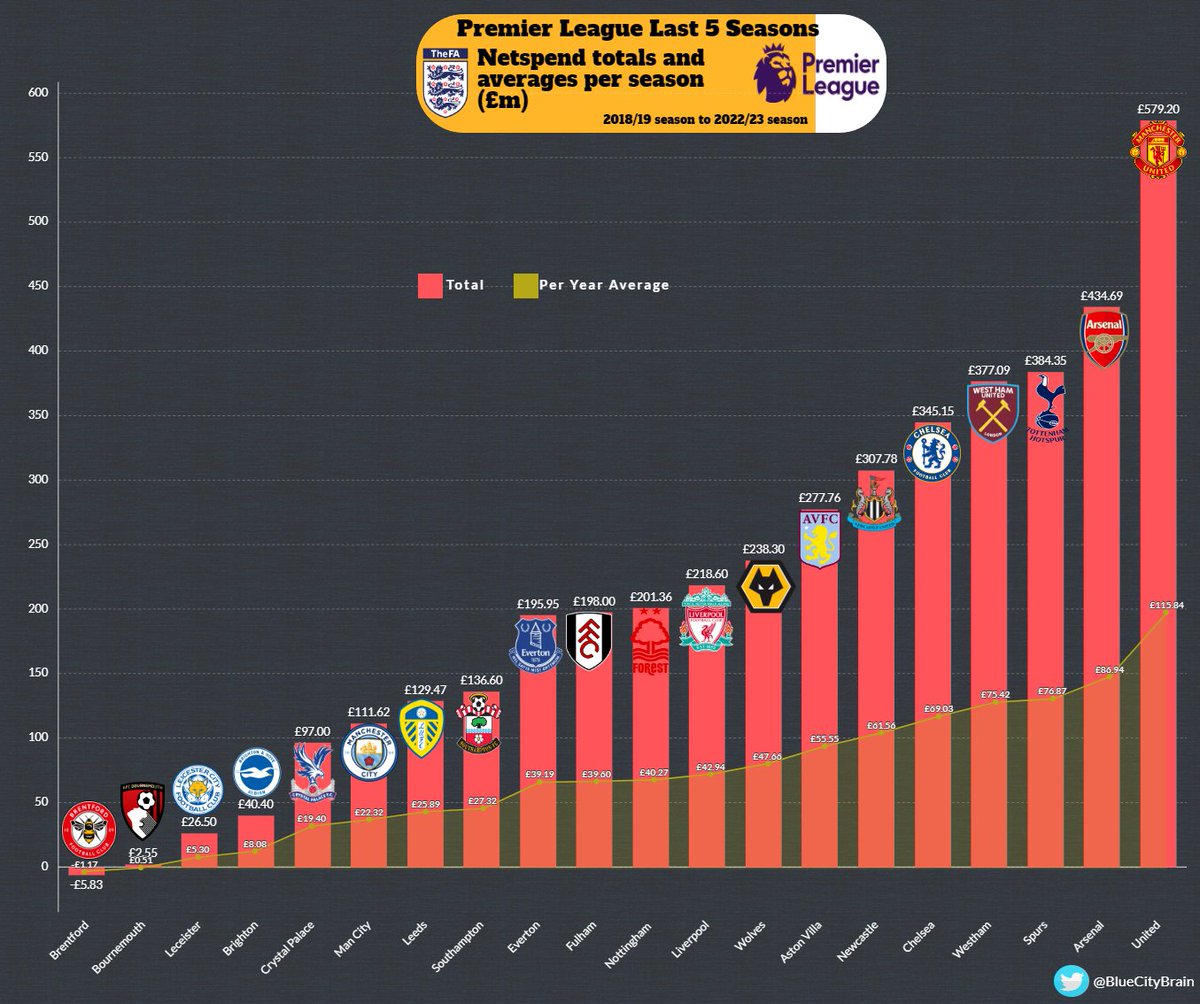
#PremierLeague last 5 seasons breakdown of transfers netspend, expenditure and sales with every team broken down (25 long thread)

First Netspend for the last 5 seasons:

#MUFC top the netspend chart with £580m Net
While 4 London clubs after sitting between £350m to £450m Purchases over the last 5 seasons:
#CFC #MUFC & #MCFC top the purchases charts
Sep 2, 2022 5 tweets 4 min read
#PremierLeague transfer expenditure, sales and net all combined for 2022 Summer Window -

Lets start with the 2022/23 Summer Net Spend: #PremierLeague broke a few records this window. ⬛️With near £2.2bn spent and a
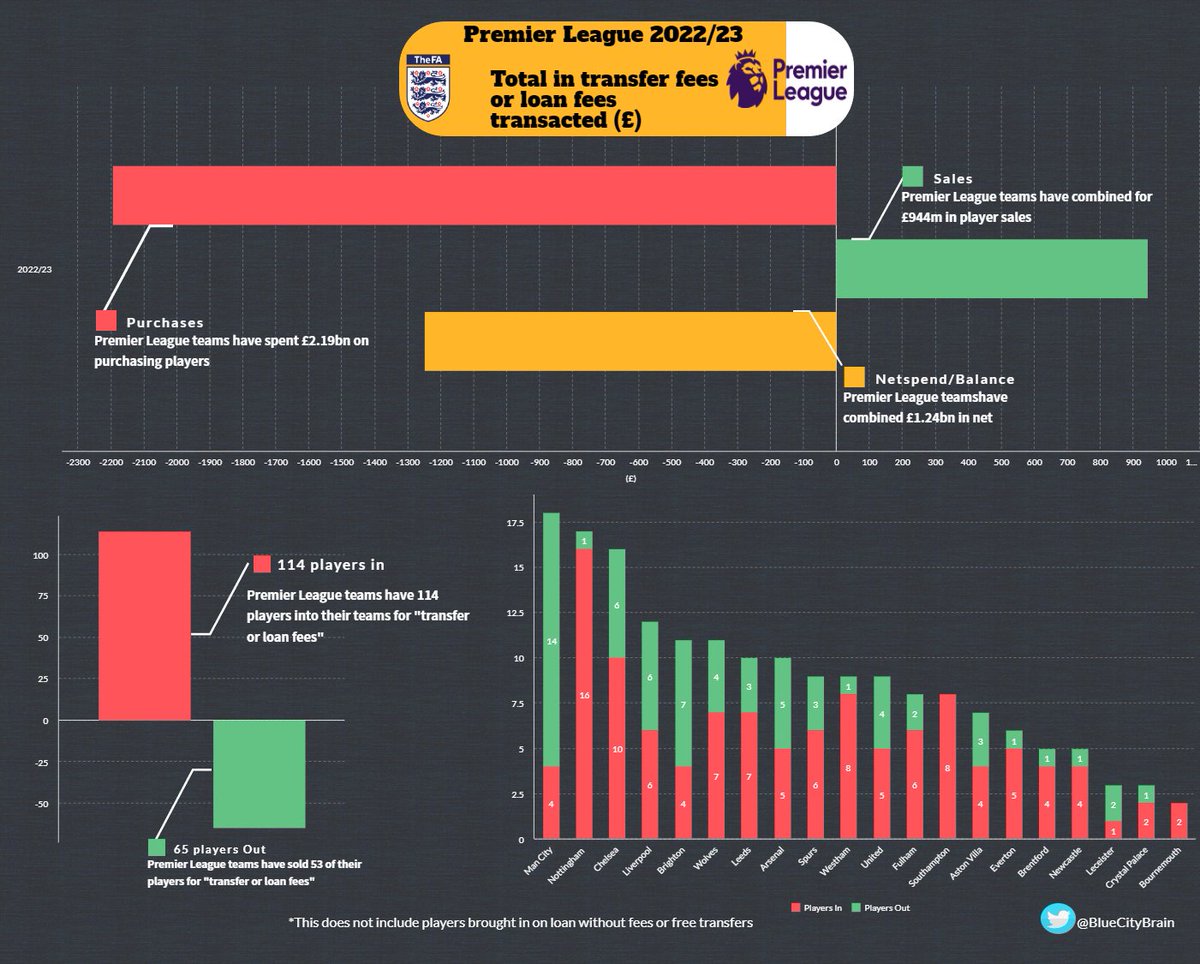
⬛️NetSpend of £1.24bn 📈
Jul 20, 2022 10 tweets 4 min read
A thread on Last 5 season Top 6 comparison #NetSpend head to head.

Plus individual NetSpend per team for the last 5 seasons

#MCFC, #LiverpoolFC, #MUFC, #Arsenal, #Chelsea, #Spurs Average spend, purchases and NetSpend per year for the last 5 seasons