Professional trader. Wall Street veteran for 20 yrs in NYC working w/ the largest HF's in the world. Founder CSC Macro Report & Trading Services 👇👇👇

 2/8 Mar was the swing low, and underperformed meaningfully since. DeMark signals caught the low and now printed @ recent high. Why is this important?
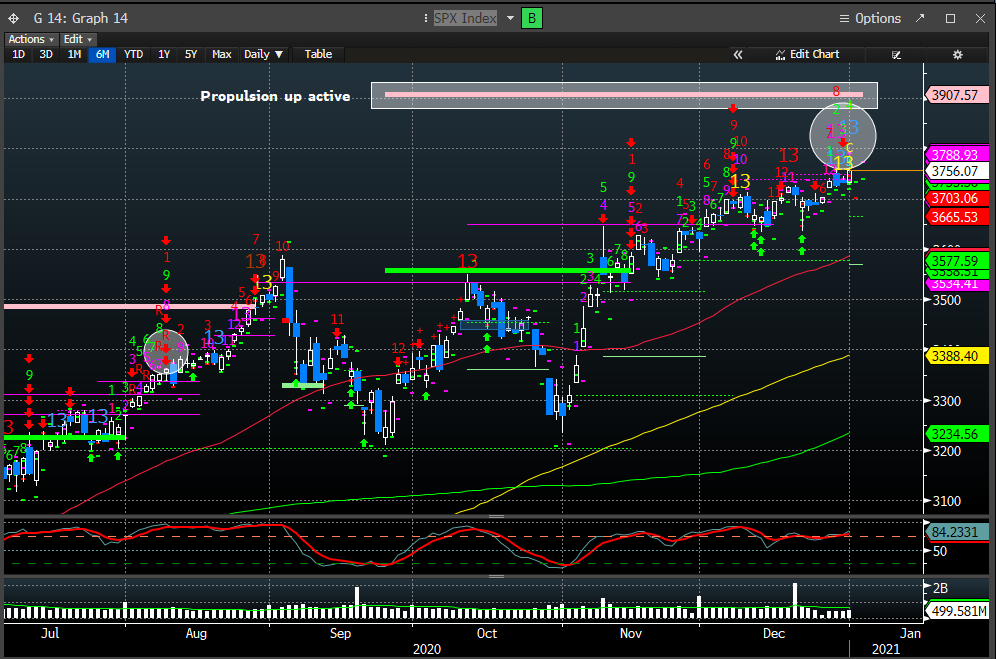
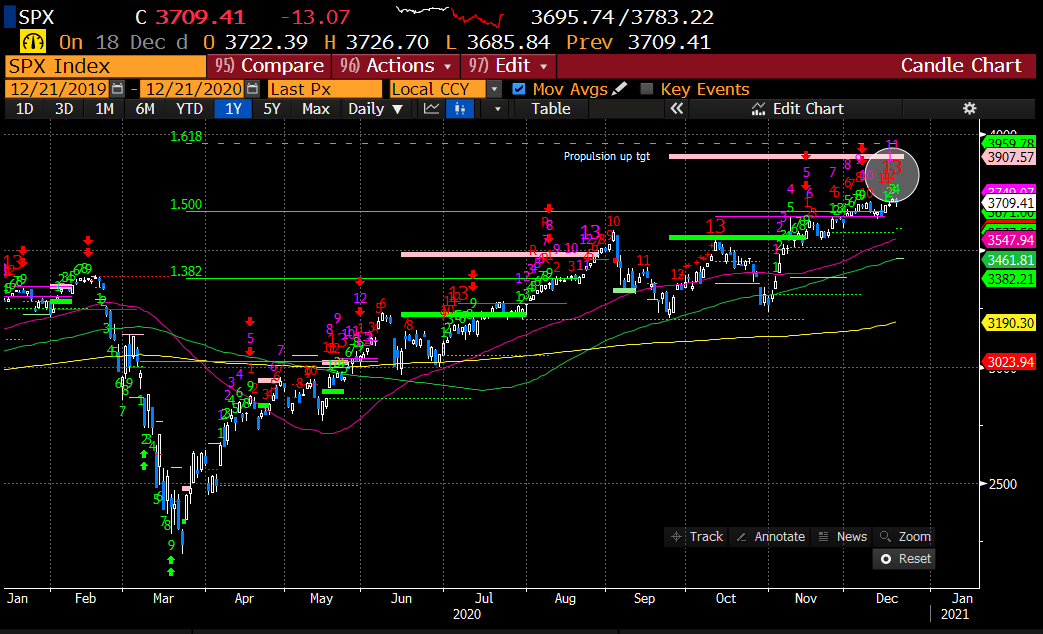
 #stockmarket Demark propulsion up tgt still active w/ 3907 tgt but stuck on 10 count for the seq 13 sell since Jan 8th. still could post this wk as early as weds....
 #stockmarket New Seq Demark 13 sell possibly this wk (earliest weds). Propulsion up tgt of 3907 still in view. maybe we hit the tgt while posting the new 13 sell? Reminder the propulsion lvls can act as magnets but also exhaustion lvls. Last 2 13 sells saw short +2% drawdowns...
 #stockmarket to further this comment. Ysty was epic, but i dont want to give a bunch back so i sold some strength and raised stops. my feeling is next week will be more tricky so plan accordingly.
 #StockMarket As I've said repeatedly, tough to be overly bearish above 3630ish & a close below the 20day has been elusive. A close below might shake things up but for now new box B/O w/ measured move to 3800+...
 #stockmarket A close below $364ish would shake things up a bit I suspect but elusive at this point. $SPY weekly looks quite healthy to me....
 #stockmarket Momentum tgts signify trend continuation but also could represent exhaustion points. The Russell also w/ new Demark 13 sells on the weekly chart to go w/ a new round of daily sell signals....


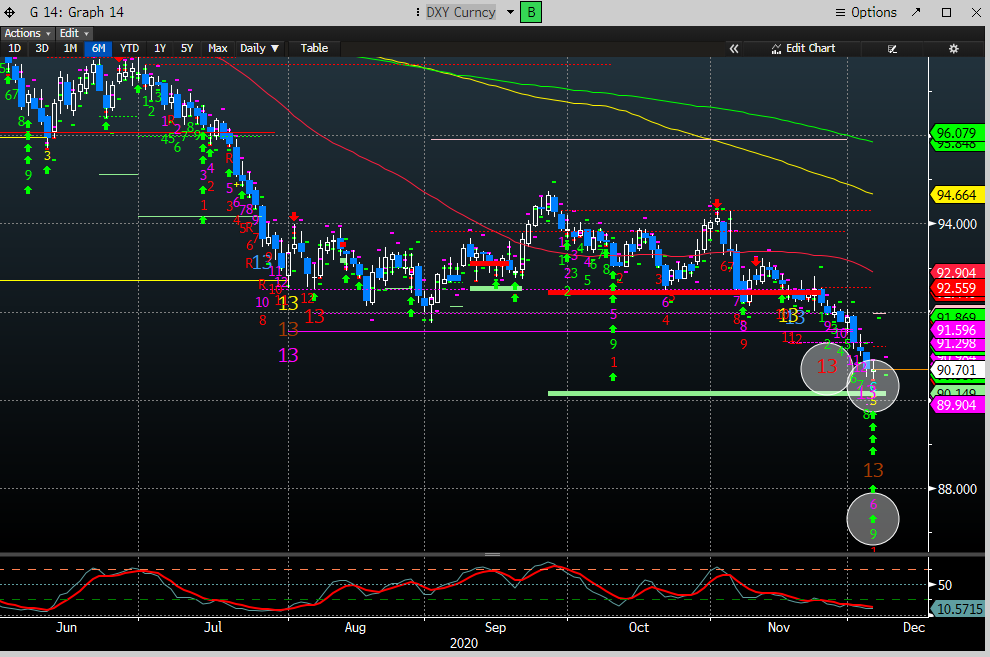
 #stockmarket As I've mentioned in previous updates, $ spikes are equity bearish & last wk we did see #DXY move off the lows. Whether this a minor bounce or bigger countertrend move is yet TBD. $DXY bounce from OS RSI now above 14day SMA & day 3 of price flip; needs to be watched.

 #stockmarket #SPX correlation to USD has been strong & previous spikes this yr have seen equity dislocation. This is the most important thing to watch IMO given how lopsided this trade has become. Demark has a 13 Seq/Combo & 9 buy in place/ w/ prop down tgt of 90.15 for $DXY...
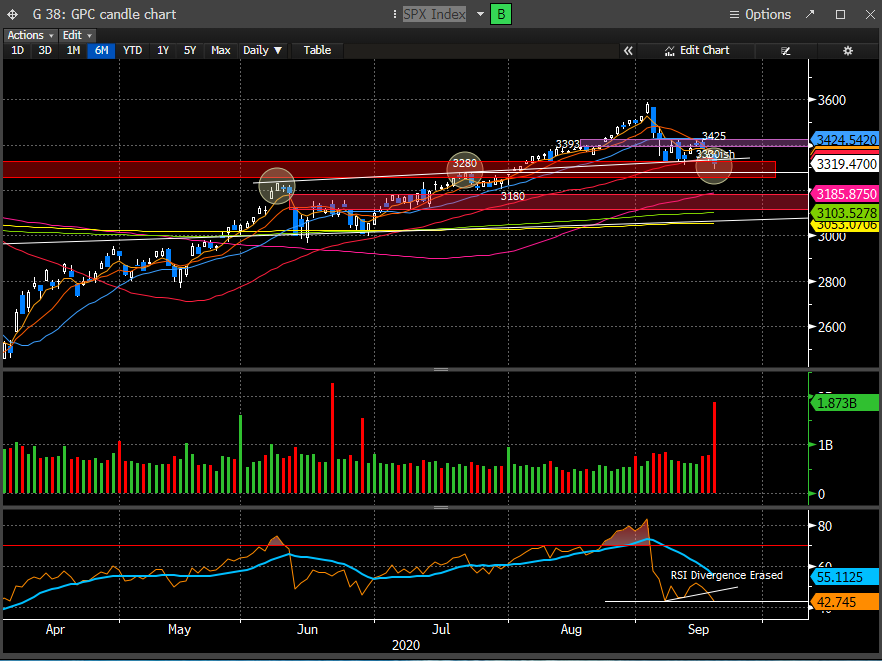
 #stockmarket marked white circles (above) are showing heavy volume distribution days since Sept is not bullish. But for now the supply is getting absorbed. The Demark chart shows Day 2 of a price flip down following the completed 9-13-9 sell, and closed <5day EMA....
 #StockMarket #SPX here is another rarity & one for the bears, Demark 9-13-9 sell is also printing on the yearly chart, which has taken 40+ years to form. Not sure how to trade this but interesting nonetheless...

 #stockmarket #SPX $SPY also will post Day 5 of 9 sell set up, which would come on Friday if the count is satisfied. Demark Trrendfactor up lvls to be mindful of: 1x up = 354.90, 1.5x=358.47
 $YALA whoa!
 #stockmarket $SPY also bouncing around the 1.5x TF level of 324 & closed above. I said on Friday that I thought we were at a level where the mkt might bounce & it did. Day 5 of Demark buy set up. We are also into the green zone where there is price memory.....
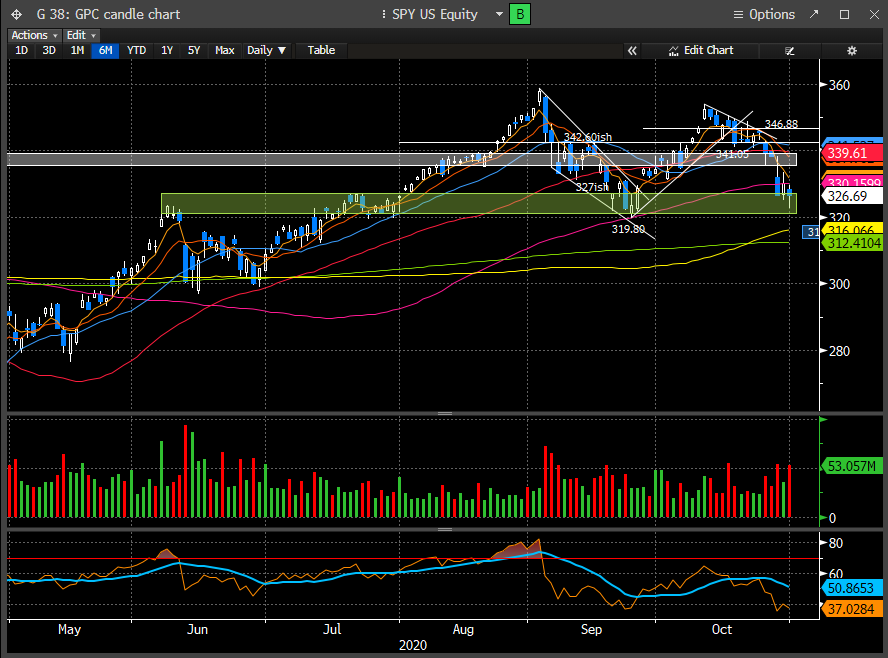

 #stockmarket #Nasdaq is similar & held an important level. threatening to break the Asc Triangle formation and also above key MA's...
 #stockmarket Demark Trendfactor lvls continue to be a good guide. 13 sell peaked @ 1x up lvl, & found support on 1/2 lvl down. see white boxes for up lvls & blue for down lvls in chart above. daily #SPX chart below also showing a close right @ 5 day EMA on Fri....
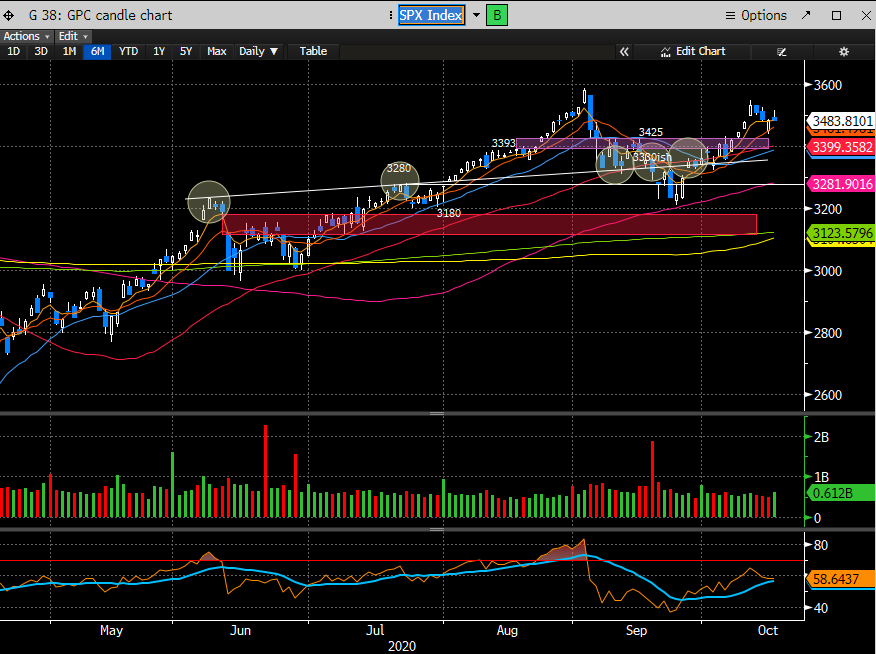


 volume 👌
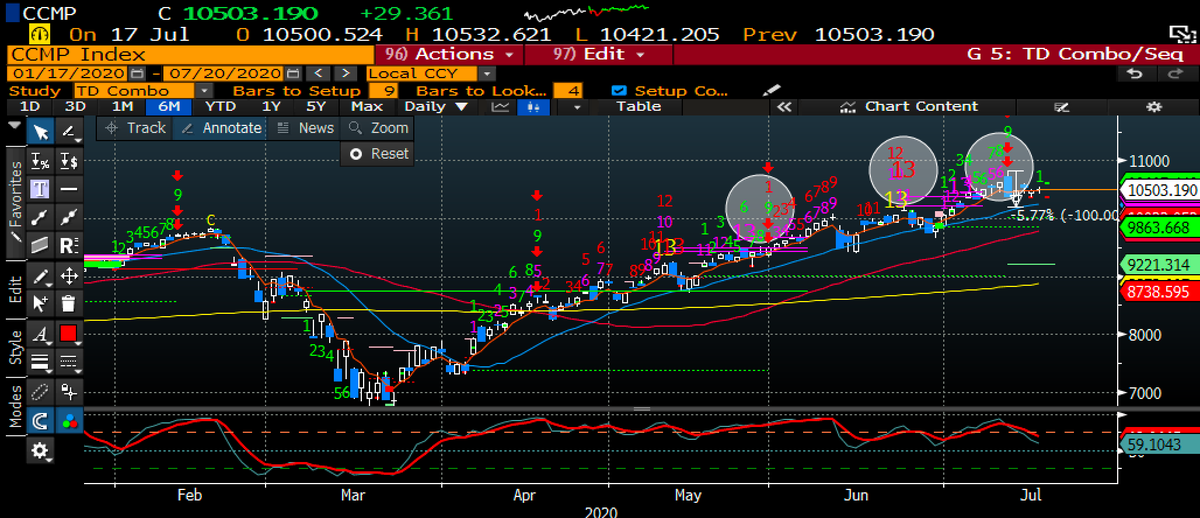
 #StockMarket #SPX I also mentioned the pot'l for a midwk turnaround on Demark exhaustion signals but early wk strength negated the count & has now started over. the Naz also erased its count & now has a Demark propulsion down tgt of 10470. still looks very vulnerable....
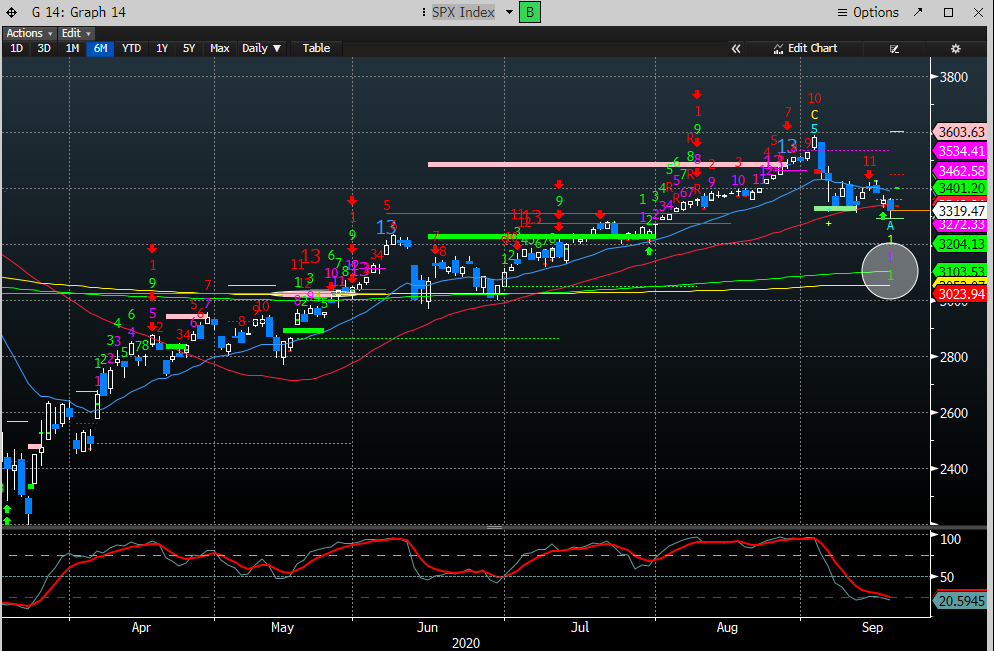


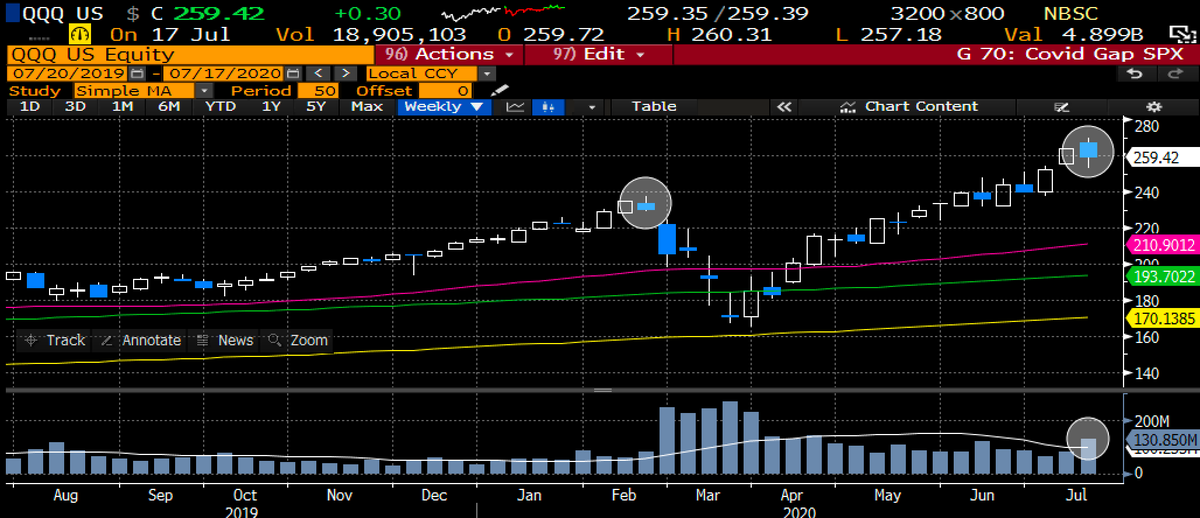
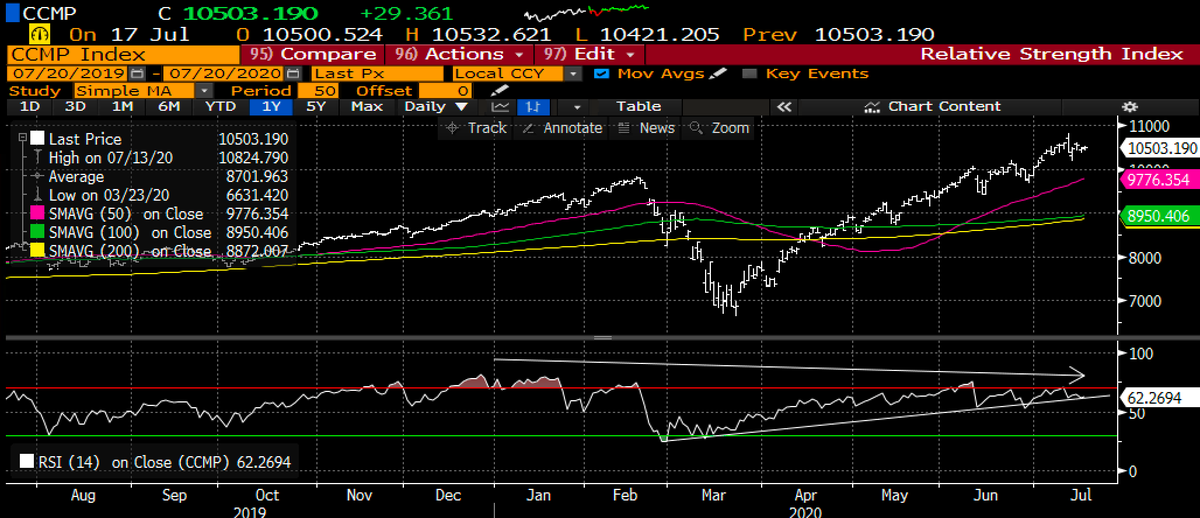
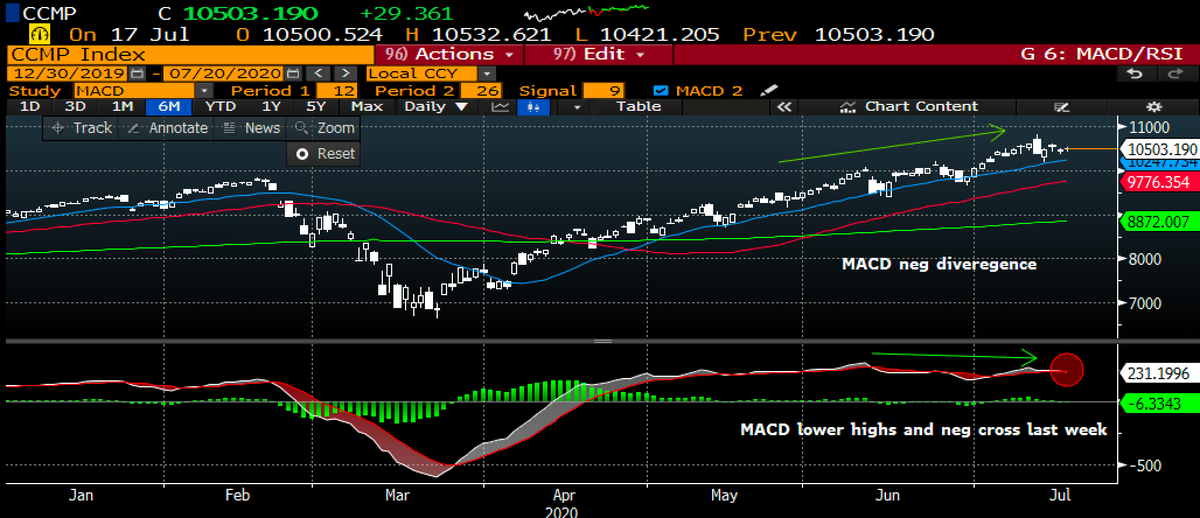
 #StockMarket $QQQ weekly ugly candle on elevated volume and last time we saw that happen, more weakness ensued. RSI continues to neg diverge & now threatening to break the RSI trend line. MACD neg divergence as well w/ recent lower high and neg cross again....