
Professor of Biostatistics at St. Luke's International University, Japan. Mastodon: @drStuartGilmour@home.social.


 A recent presentation by Hong Kong University (HKU) professors has been used by the usual China “experts” and journalists to argue that reliance on China’s vaccine, Sinovac, compared to BioNTech’s mRNA vaccine was a bad idea, with tweets like this.
 The map is based on the Global Health Security Index, a numerical measure of pandemic preparedness compiled by Economist Impact in collaboration with Johns Hopkins and others. There is a published report, with a clear methodology.
 When the Great East Japan Earthquake and Tsunami hit I was a brand new assistant prof, living in Tokyo for two weeks. Almost as soon as it happened all the Japanese students from the dept I worked in headed north to help with recovery. [I took these photos in Feb 2012]

 I’m spending the afternoon watching the year end mixed martial arts, #rizin33, so it’s as good a time as any to examine the new surge in cases in the UK. There’s a lot of talk that omicron is less severe and hospitalizations won’t rise, but I’m not convinced. Let’s look.
 Before we do, let’s just take a moment to appreciate the deep racism of this picture from a report using the Economist's numbers by the Centre for Strategic and International Studies. When you see a cover pic like this, you can guess what the contents are gonna be.
 Snopes targeted this meme as false in September 2021, and briefly mentioned a news article in December 2020 that released the names, and says no government has verified it. Its role in helping to fuel anti-vax sentiment is clear from reddit subs like r/HermanCainAward.
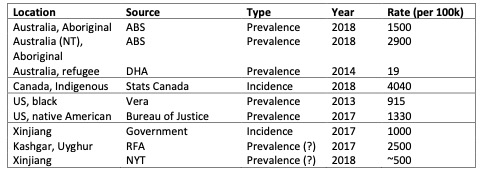 These China “experts” are intent on uncovering these statistics and on activism in international forums to challenge mass imprisonment in China. Meanwhile their own countries are imprisoning indigenous people or minorities in huge numbers but they say nothing. Why?
 In response to the bombing of urban centres the UK Tory government evacuated a million women and children to the countryside, introduced a curfew, enforced a blackout and banned certain forms of speech harming the war effort.
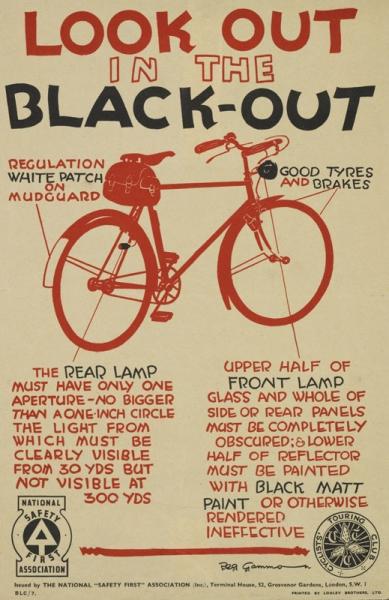
 In August 2001 the MV Tampa rescued 433 refugees at sea. 244 of them were Afghans, fleeing the Taliban, and following the laws of the sea Tampa attempted to land them in Australia. The Australian government refused to take them.
 2/ here is the report, it’s a preprint and also accepted at the journal Central Asian Survey. papers.ssrn.com/sol3/papers.cf…
 @adrianzenz @Nrg8000 @ASPI_org @GuardianAus As you can see from that figure, birth rates in some municipalities (市区町村) in Japan dropped by more than 50%. Here are some example trajectories from 1970 – 2010.
 First, I have worked with colleagues at SYSU on mathematical models of HIV in men who have sex with men (MSM) in China, to estimate the benefits of Pre-exposure prophylaxis (PrEP) [2/9] bmcinfectdis.biomedcentral.com/articles/10.11…
 @aspi_icpc @Nrg8000 @jleibold In fact we can build a better model that shows “coercive birth-control policies” were less effective in Uyghur areas. It explains more of the variation than the figures in your report. Why did you not present this model?