Michele Tizzoni 🇺🇦 Profile picture
Complex networks, infectious diseases, data science || Science is what you understand well enough to explain to a computer [D.Knuth]
Nov 15, 2020 • 6 tweets • 2 min read
Leggo con interesse la grande enfasi che viene data dai quotidiani italiani, in particolare La Repubblica, alla scoperta del fatto che SARS-CoV-2 stesse circolando in Italia da Settembre 2019 repubblica.it/cronaca/2020/1… Sono andato a cercare lo studio in questione: journals.sagepub.com/doi/full/10.11…
Mi incuriosisce il fatto che uno studio che mostra un risultato così importante (direi eclatante) venga pubblicato su una rivista molto specialistica, nel campo dell'oncologia, e con IF non particolarmente alto
Oct 2, 2020 • 8 tweets • 5 min read
I casi di #COVID19 in Italia sono aumentati nelle ultime settimane ma qual è la probabilità che almeno una persona positiva a SARS-CoV-2 sia presente in un gruppo di 10 o 100 o 1000 persone? Per provare a rispondere, abbiamo sviluppato Eventi e Covid-19 👉datainterfaces.org/projects/covid… La mappa mostra una stima del rischio di essere esposti al virus SARS-CoV-2 per provincia, sulla base del numero di persone che partecipano ad un evento. Il rischio è espresso come la probabilità che almeno un individuo positivo sia presente all'evento. 👇
Jul 21, 2020 • 6 tweets • 4 min read
In the past months, we have been monitoring the mobility of Italians during the COVID-19 emergency using data from @Cuebiq's Data4Good program. We published aggregated mobility metrics updated until April 17 in @ScientificData nature.com/articles/s4159… 1/N Today we are happy to release an *updated version of the dataset* with a timeline that covers the period January 18 - June 26, 2020.
The data is available on the @humdata Humanitarian Data Exchange: data.humdata.org/dataset/covid-… 2/N
Jun 30, 2020 • 4 tweets • 2 min read
In questo breve articolo, mostriamo come la stima di R(t) dipenda in modo critico dai dati utilizzati come input dell'algoritmo di ricostruzione (e molto meno dal tipo di algoritmo usato). Conoscere la curva epidemica con le date di insorgenza dei sintomi è fondamentale. ci sono diversi metodi che cercano di inferire la data di insorgenza dei sintomi usando la distribuzione del ritardo tra sintomi e notifica. In questo lavoro mostriamo che in genere questi metodi non sono sufficientemente accurati e possono introdurre errori non trascurabili.
Jun 17, 2020 • 8 tweets • 6 min read
After 2+ years of hard work, our paper on measuring gender gaps in human mobility with mobile phone data is finally out! nature.com/articles/s4159… It's been a great team effort! thanks to @laetitiagvn @ciro @simonepiaggesi @nataliaadler19 @sverhulst @_AndrewYoung @leoferres
1/N Image In this work we analyzed a large dataset of de-identified CDRs from mobile phone users in Santiago, Chile, and tried to answer the question: do women move differently than men, in the city? tl;dr - Yes, they do.
2/N Image
May 28, 2020 • 6 tweets • 3 min read
Our 5th report on the COVID-19 Mobility Monitoring project is out: covid19mm.github.io/in-progress/20… In the past weeks we observed a slow but steady increase in the mobility and proximity of Italians. Users’ movements between different provinces are now at -30%, on average, w.r.t the baseline. The median of users’ movements on connections within the same region has increased to -27%. Movements on connections between provinces of different regions have increased to -60%.
May 14, 2020 • 7 tweets • 4 min read
Poco fa ho avuto modo di parlare a @fuoritgtg3 dei modelli computazionali per l'Italia sviluppati dal gruppo di @alexvespi a @Northeastern con un fantastico team di collaboratori: covid19.gleamproject.org/italy Alcune cose che si possono imparare dai modelli: 
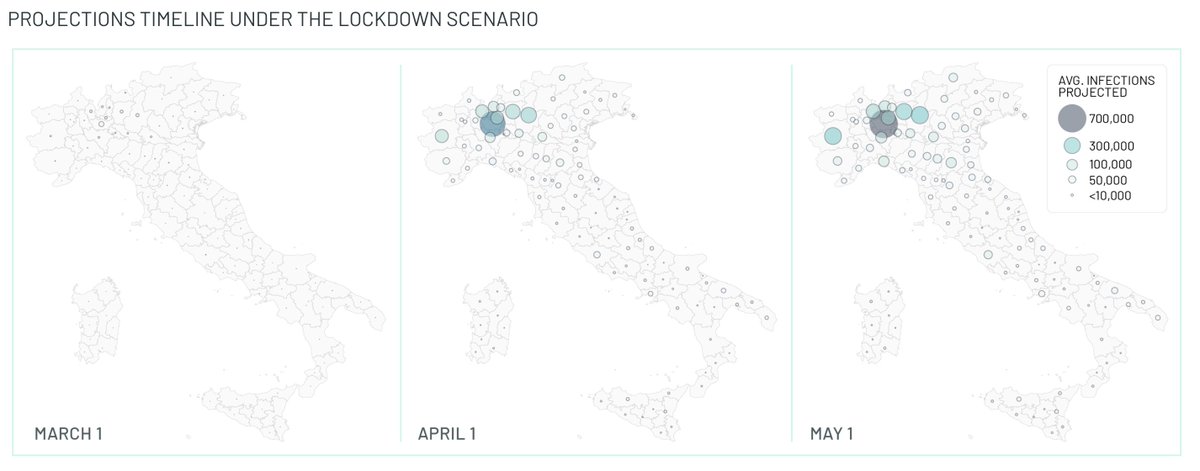
Allo stato attuale, il modello desume che circa l'8% della popolazione italiana sia stato contagiato nel corso degli ultimi 3 mesi. Ci sono grandi variazioni regionali: nel Nord Italia il numero dei contagiati è probabilmente superiore al 10% mentre nel Sud è inferiore al 4%.
May 12, 2020 • 7 tweets • 4 min read
In Italy, the lockdown was lifted one week ago. #Phase2 has started. In our fourth report, we present the results of the analysis of @Cuebiq mobility data in the past week: covid19mm.github.io/in-progress/20… w/ @laetitiagvn @ciro @social_pepe P.Bajardi @ISI_Fondazione Overall, average mobility and proximity metrics have reached levels similar to those that were observed at the beginning of the week of March 9-15, which is immediately after the first nationwide stay-at-home order was issued (March 8). Image
Apr 30, 2020 • 5 tweets • 2 min read
Come spiegato bene da @m_starnini, due giorni fa i giornalisti de @Linkiesta riprendono un'analisi strampalata piena di errori fattuali e ci fanno un titolo acchiappa-click: "Il comitato scientifico (forse) sbaglia". Oggi, il comitato scientifico replica a queste critiche, mostrando come siano basate su errori grossolani. Si potrebbe chiuderla qui, magari con una correzione all'articolo che riportava questi errori. Gli articoli del @nytimes spesso vengono corretti in seguito a verifiche.
Apr 24, 2020 • 5 tweets • 3 min read
Una conferenza stampa molto importante in cui Stefano Merler @FBKcom spiega in modo puntuale e perfetto l'analisi epidemiologica dei dati di #SARSCoV2 in Italia. I dati sono inutili? No. Possiamo imparare molto se sappiamo come trattarli. Alcuni risultati importanti: R(t) sotto soglia in tutte le regioni italiane a partire dal 25 marzo. Valori attuali di R(t) stanno nel range 0.3 - 0.7. Tutto finito? No. C'è del margine, ma basta poco per tornare a R(t)>1 e dover richiudere tutto.
Apr 21, 2020 • 4 tweets • 3 min read
I have seen many discussions about the statistical errors in the now-famous #SantaClara antibody prevalence study. When I first read it, though, the abstract caught my attention: "Participants were recruited using Facebook ads targeting a representative sample of the county" This may seem a very reasonable approach for Santa Clara. However, it is important to note that Facebook ads do *not* target a representative sample of the population in rural areas. This is what we found in our paper - just out in the @TheWebConf dl.acm.org/doi/fullHtml/1…
Apr 15, 2020 • 6 tweets • 3 min read
Thanks to @kevin I've made small changes to his code to estimate the time-varying reproductive number (Rt) for Italy both at the national and sub-national levels. Vertical bars correspond to the timing of major interventions (the last one being national lockdown). Image The current standing of R by region is shown here. Lazio and Piedmont still on the edge of R=1. Veneto looks solid under control. Code available here: github.com/micheletizzoni… Image
Apr 3, 2020 • 5 tweets • 2 min read
The Ministry of Health has just updated weekly mortality estimates in Italy for the week 18-24 March. Sadly, but expectedly as I tweeted a few days ago, the curves are skyrocketing and it's not over yet. Full report here: salute.gov.it/portale/caldo/… Image 
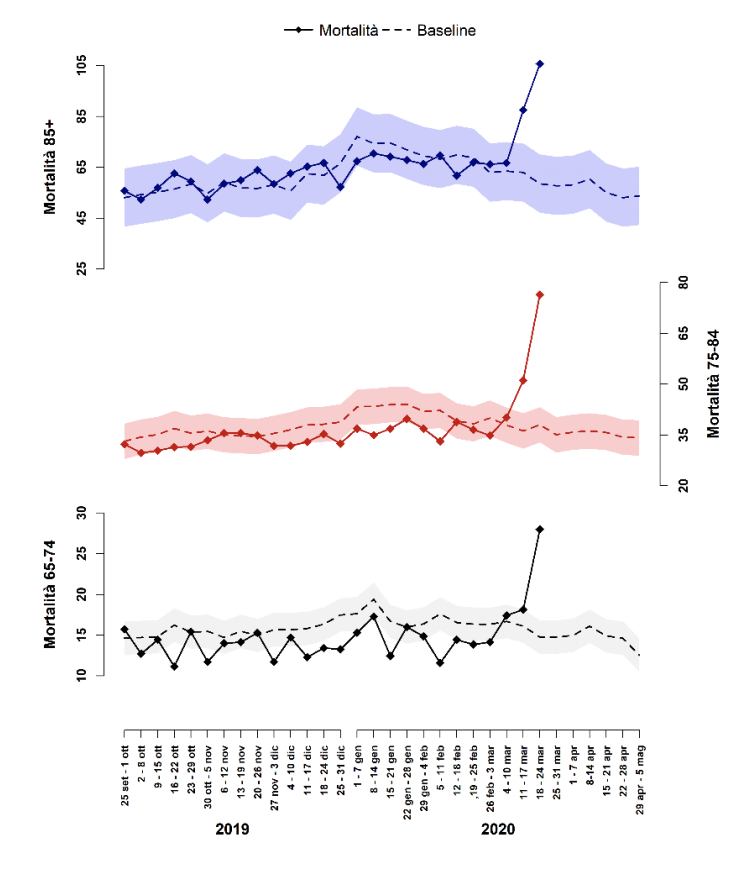
The above charts refer only to Northern Italy. These numbers are not comparable to any past flu season. Before jumping to conclusions, take a closer look at the chart below: it's updated to the week 4 of 2020, which means January. Data is still missing. Image
Mar 7, 2020 • 4 tweets • 2 min read
These days I try to keep updated on the #COVID19 modeling research that is getting published. It's hard to keep track of all the important studies that are being posted on medXriv daily. Here is an important contribution by a stellar team from @HarvardChanSPH "Projecting the transmission dynamics of SARS-CoV-2 through the post-pandemic period" where @mlipsitch @StephenKissler and collaborators simulate the transmission of SARS-CoV-2 through the year 2025 (!)
medrxiv.org/content/10.110…
Mar 7, 2020 • 6 tweets • 3 min read
Come scrivevo qualche giorno fa, analizzando il numero di casi di #COVID19 esportati dall'Italia verso altri paesi è possibile stimare il numero di casi di #COVID19 in Italia. (1/n) Alcuni ricercatori dell'Università di Toronto lo hanno fatto, pubblicando i risultati qui: medrxiv.org/content/10.110… [attenzione non è ancora un studio peer-reviewed]. Tra gli autori: @DFisman @AshTuite (2/n)
Feb 24, 2020 • 6 tweets • 2 min read
Una lettura accessibile ma molto precisa per capire meglio che cosa sappiamo ma soprattutto cosa *non* sappiamo delle caratteristiche epidemiologiche di #covid19 #coronavirusitalia harvardmagazine.com/2020/02/fighti… l'articolo raccoglie i commenti di alcuni tra i più importanti esperti mondiali di epidemiologia, tra cui @mlipsitch - un'autorità in questo campo. Ecco alcuni punti rilevanti:
-> R0 varia tra 1.5 e 2.5, quindi piĂą basso di SARS ma comunque ben al di sopra della soglia epidemica
Feb 28, 2019 • 5 tweets • 3 min read
Un recente report @CEP_EU ha ricevuto grande attenzione mediatica per le conclusioni sull'impatto che l'Euro ha avuto sul PIL pro-capite italiano. Come ben spiegato da @ale_martinello lo studio contiene dei seri problemi metodologici. CC @micheleboldrin @ThManfredi @SMerler Uno dei problemi principali è che lo studio non riporta nessun errore associato alle stime di impatto, come invece dovrebbe fare qualsiasi serio studio statistico. Ma il metodo usato - Synthetic Control - consentirebbe di ottenere delle stime con un intervallo di confidenza.