Richard Neher Profile picture
i am a biologist/physicist at the @biozentrum in Basel trying to understand how microbes evolve. views are my own, RT!=endorsement.
John Miller Profile picture 1 subscribed
Aug 23, 2022 12 tweets 4 min read
Since its emergence in late 2019, #SARSCoV2 has diversified into multiple distinct variants.

In a new preprint, I quantify evolution within these variants and compare it to the process that gave rise to these variants.

biorxiv.org/content/10.110…

1/N Within each variant, diversity and divergence increase linearly with time. The rate of synonymous evolution is around 6 changes per year in all variants, while the non-synonymous rate varies from variant to variant.

2/N
May 29, 2022 5 tweets 3 min read
Poxviruses have low evolutionary rates of around one mutation per genome per year. The #monkeypox sequences associated with the recent outbreak, however, differ by about 40 mutations from viruses sequenced 4 years ago. [1/5]

nextstrain.org/monkeypox Since 2017, the lineage leading to the recent samples has a peculiar mutation pattern where almost all mutations are G->A or C->T. Furthermore, they almost all occur in specific sequence contexts as Andrew Rambaut discusses here:

virological.org/t/discussion-o…

[2/5]
Feb 24, 2022 7 tweets 3 min read
Reference genomes don't capture all genetic diversity. This is particularly true for bacteria, where one strain can have 100s kilobases a close relative lacks. This is often summarized by gene-by-gene 'bean-bag' pan-genome analysis.

But genome structure matters! 1/ Image Nick @n_b_noll has developed a PanPraph for scalable construction of pan-genome graphs from closely related bacterial genomes or plasmids. 2/

biorxiv.org/content/10.110…
Feb 16, 2022 6 tweets 2 min read
Influenza viruses have segmented genomes and segments can be reassorted when multiple viruses infect the same cell.

Reassortments can combine traits of multiple viruses and thereby speed up adaptation, but are hard to analyze and thus often ignored. 1/ Pierre Barrat has developed am algorithm to infer reassortments between two segments of influenza viruses.

TreeKnit constructs the (observable) Ancestral Reassortment Graph by gluing two trees together starting from the tips. 2/

biorxiv.org/content/10.110…
Feb 14, 2022 6 tweets 3 min read
New work by @valentindruelle on mutations that make the HIV-1 genome closer to the global HIV consensus:

- These mutations are positively selected within host.
- At the population level, these mutations result in spuriously low rate estimates.

1/

biorxiv.org/content/10.110… Within hosts, positions that are initially in a non-consensus state change much faster than consensus positions. This acceleration is particularly pronounced at 2nd positions in codons, that are typically more conserved than 3rd positions.
2/ Image
Jun 7, 2021 5 tweets 2 min read
The δ variant has caused devastating outbreaks in South Asia and has recently become dominant in the UK, displacing the very transmissible variant α. Various lines of evidence point towards an even higher transmissibility of δ.

But there are some puzzling aspects. [1/5] As others have pointed out, the δ variant is diverse with a common ancestor at some point last summer. Many genotypes spread across the world, not just one particular lineage as you would expect if a more transmissible variant suddenly started to spread. [2/5]
Oct 28, 2020 5 tweets 2 min read
#SARSCoV2 hospitalizations and deaths are rising fast across Europe and politicians face the difficult task to find measures that work while minimizing disruption. People will use tracing statistics to argue for or against measures. But bear in mind that these are biased. The @rki_de publishes a fairly detailed breakdown of known transmission settings and households account for a big chunk.

But households are among the easiest to trace, while public transport, shopping, etc are essentially impossible.
Sep 19, 2020 8 tweets 3 min read
I think the least disruptive way to control #SARSCoV2 is to act early, focus on high transmission settings, masks, and Test-Trace-Isolate-Quarantine to keep Re below 1. But with rising cases, this strategy looks less and less plausible in many parts of Europe.
[1/7] This could be a prelude to what I fear will be a difficult winter. Controlling #COVID19 will require combinations of tighter measures with difficult trade-offs and serious societal, health, and economic implications.


[2/7]
Aug 20, 2020 5 tweets 2 min read
The low case fatality of #COVID19 in Europe over the last month still triggers a lot of speculation on what might be different now: not much!

It can be almost entirely explained by
* steep age dependence of fatality
* a markedly different age distribution of cases
1/5 Comparing the age distributions of confirmed cases in Switzerland before and after June 1st, you see a strong shift towards young adults and very few cases in people >70y.
2/5
Aug 13, 2020 10 tweets 6 min read
What happens to #COVID19 when winter returns to the Northern Hemisphere is still uncertain, but here are some things we know:

- people will spend more time indoors
- indoor air will be drier and less ventilated
- endemic CoVs have pronounced seasonality.

1/8 Image 
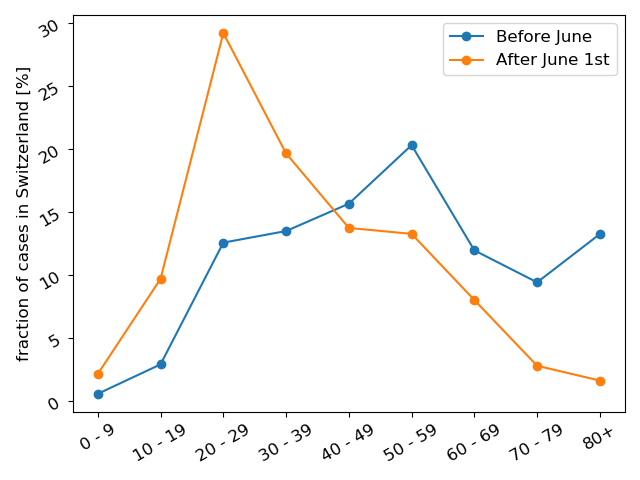
The 2009 H1N1 influenza pandemic might offer some clues. H1N1pdm is much less deadly, but much like #SARSCoV2 it

- is an enveloped respiratory virus that spreads via droplets
- in 2009 hit a mostly susceptible population

(there are important differences too, see below)
2/8 Image
Aug 1, 2020 7 tweets 3 min read
Pierre Barrat just posted a preprint on influenza virus evolution (with me @huddlej @trvrb).

Influenza escapes preexisting immunity by rapidly changing its surface proteins. You'd expect that mutations that come up quickly are beneficial and sweep [1/7]

biorxiv.org/content/10.110… 
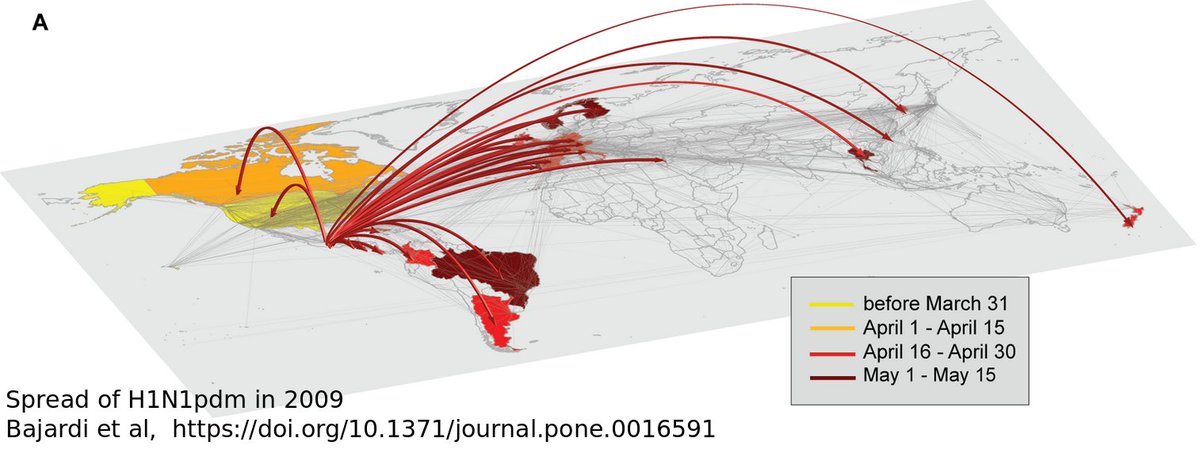
Pierre found that this is not typical behavior. Mutation trajectories of H3N2 in the last 20y that rapidly rose from 0 to 30% in frequency show no trend of increasing further in frequency. The fixation probability of a mutation at frequency x is almost exactly x! [2/7]
May 14, 2020 8 tweets 2 min read
Science and publishing in times of #COVID19 have been a bit of a mixed bag. Critical information from the frontlines was shared within days, but others have fuelled conspiracy theories with baseless claims, or flooded preprint servers with useless manuscripts. 1/n In Jan and Feb, many extremely important articles were published that provided critical information in a very timely manner. Chinese scientists have taught the world a lot about #SARSCoV2 before it caused big outbreaks elsewhere. 2/n
Apr 21, 2020 5 tweets 3 min read
Many preliminary #SARSCoV2 seroprevalence studies are published (or rather publicized) these days and results >2% are often taken as evidence that #COVID19 is more widespread than estimated. Keep in mind that we expect prevalence >10% in many places that have been hit hard. Image 
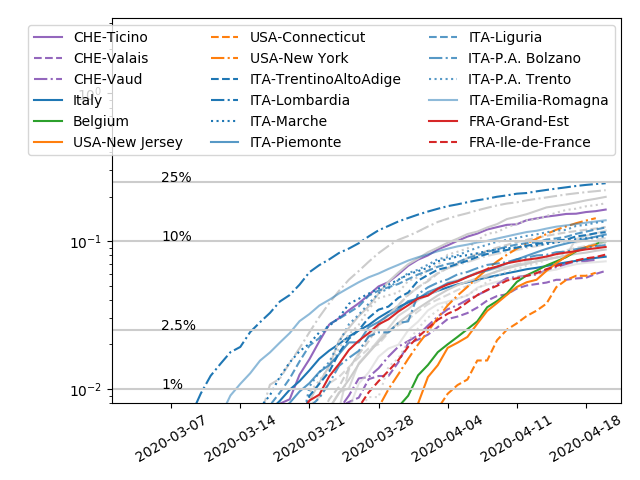
The graph shows a simple estimate of prevalence assuming an IFR of 0.5% and the same delay to death and seroconversion. The numbers are for countries, states, or regions. There is considerable variation within these and seroprevalence depends a lot on the population tested.
Apr 18, 2020 8 tweets 3 min read
The preprint on #SARSCoV2 seroprevalence in Santa Clara County continues to make headlines. They estimate 2-4% of the population had #COVID19 by April 4 implying an infection fatality rate (IFR) of 0.1 to 0.2%.

But there are many reasons to be very skeptical. Thread... What would these numbers imply for areas like New York, Madrid or similar?

There have been ~9k #COVIDー19 deaths in NYC. IFR 0.1 to 0.2% implies 50-100% of 8.4M New Yorkers were already infected even if there were no more deaths!

All of NCY -- not just heavily affected areas!
Apr 15, 2020 5 tweets 3 min read
Some people claim #SARSCoV2 is much more widespread than we think and not so dangerous after all. While it is true that #COVID19 cases and deaths are underreported, keep in mind that:

1. Infection fatality is about 1%
2. many places haven't seen much #COVIDー19 yet How do we know? Some places have been hit very hard by COVID19. In Bergamo, as many people have died in 3 weeks as would normally die in 6 months. This corresponds to 0.5-1% of the population. Even if everybody was infected, this suggests at least 0.5% infection fatality.
Feb 17, 2020 9 tweets 4 min read
There as been a lot of talk on whether spring will stop #SARSCoV2 #COVID19 (probably not). We (me, @robert_dyrdak Valentin D, @firefoxx66, @Jan_Albert_) used data on endemic CoVs to estimate seasonal forcing and its impact on a potential pandemic. [1/9]
medrxiv.org/content/10.110… CoVs causing common cold show a pronounced seasonality in Sweden with about 10-fold higher fraction of positive tests in winter than in summer (similar to influenza and CoV data reported for other countries.) [2/9]
Feb 4, 2020 6 tweets 2 min read
Here are my latest graphs of #nCov case and fatality counts from globalcitizen's aggregated data. The doubling time of case counts has increased to about 6 days. But be aware that labs might reach testing capacity limits in the most affected areas. [1/6] 
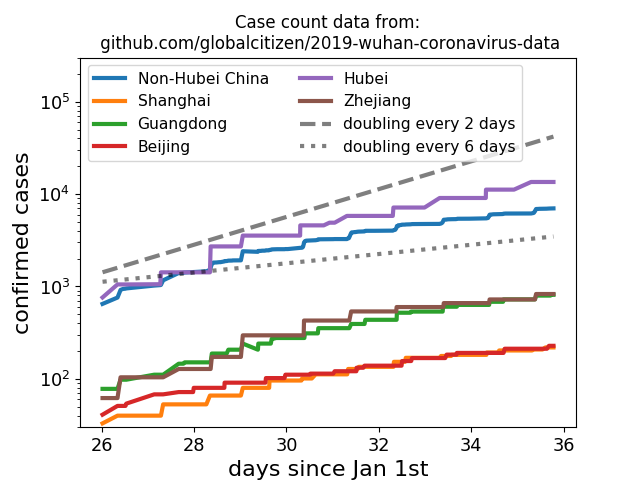
We don't see a similarly pronounced deceleration in the number of fatalities. Fatalities are expected to lag behind case counts, so this is not unexpected. [2/6]