1st condition to be met is
(a) Open = High
(b) Open = High = Previous Close
or
(a) Open = Low
(b) (b) Open = Low = Previous Close
(2/n)
(a) Open = High
(b) Open = High = Previous Close
or
(a) Open = Low
(b) (b) Open = Low = Previous Close
(2/n)
Different time frames have different interpretations Higher the TF higher the accuracy for eg a qtrly OHL will be more powerfull singal then monthly or smaller TF daily signal would be much relevant then an hourly signal !!
swill talk only about daily / weekly / monthly
(3/n)
swill talk only about daily / weekly / monthly
(3/n)
IF from
O = H is weaker if we compare to OHC (a<b)
O=L is weaker if we compare to OLC (a<b)
refer tweet 1st
in simple words more the price action on all three TF the more powerfull indicator it is if one is missing
(4/n)
O = H is weaker if we compare to OHC (a<b)
O=L is weaker if we compare to OLC (a<b)
refer tweet 1st
in simple words more the price action on all three TF the more powerfull indicator it is if one is missing
(4/n)
For easy reference 2-3 points here there will be considered as equal not carrying much weight..
if on a monthly TF we get any whether OHC / OLC the trade is initated post the close on 1st day in the direction of the trigger we had .. for eg if O=H we initiate a short
(5/n)
if on a monthly TF we get any whether OHC / OLC the trade is initated post the close on 1st day in the direction of the trigger we had .. for eg if O=H we initiate a short
(5/n)
whether every month we will get such set up is anyone's guess !! but when such set ups are identified they are easy set up..
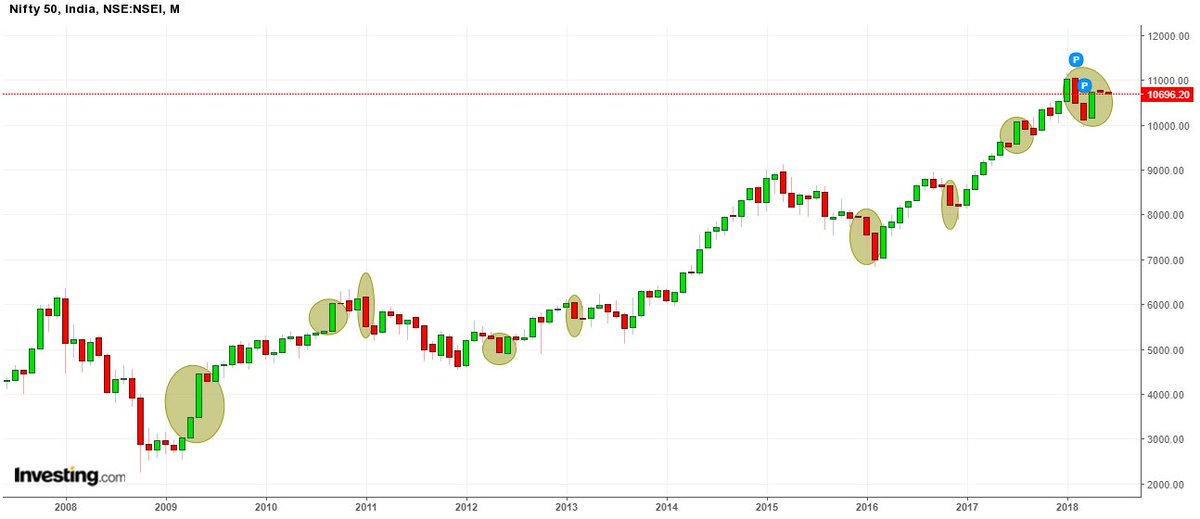
have tried to mark a few such set up on #nifty monthly charts same can be plotted on any other TF (6/n)
have tried to mark a few such set up on #nifty monthly charts same can be plotted on any other TF (6/n)
The higher the TF the better the result.. the smaller the TF more chances of whipsaws
these set ups are more visible on Daily TF across underlying but since i am not nifty trader will discuss on nifty only !!
(7/n)
these set ups are more visible on Daily TF across underlying but since i am not nifty trader will discuss on nifty only !!
(7/n)
If on Monday i.e. 1st day of week we get any set up whether OHC or OLC the trade direction is on long if O=L=C else short if O=H=C or if close is absent the same set up is carried for execution...
(8/n)
(8/n)
so here we have 2 things in our favour
1st a weekly set up and simultaneously daily set up..
since weekly is more powerfull then daily
now comes tricky part.. wht if next day or any day in a week we get a reverse set up do we close down weekly set up..
(9/n)
1st a weekly set up and simultaneously daily set up..
since weekly is more powerfull then daily
now comes tricky part.. wht if next day or any day in a week we get a reverse set up do we close down weekly set up..
(9/n)
as a trader if you are trading on daily basis one needs to cut down weekly set up n move on to daily set up.. for positional trades the weekly set up is alive till nullified
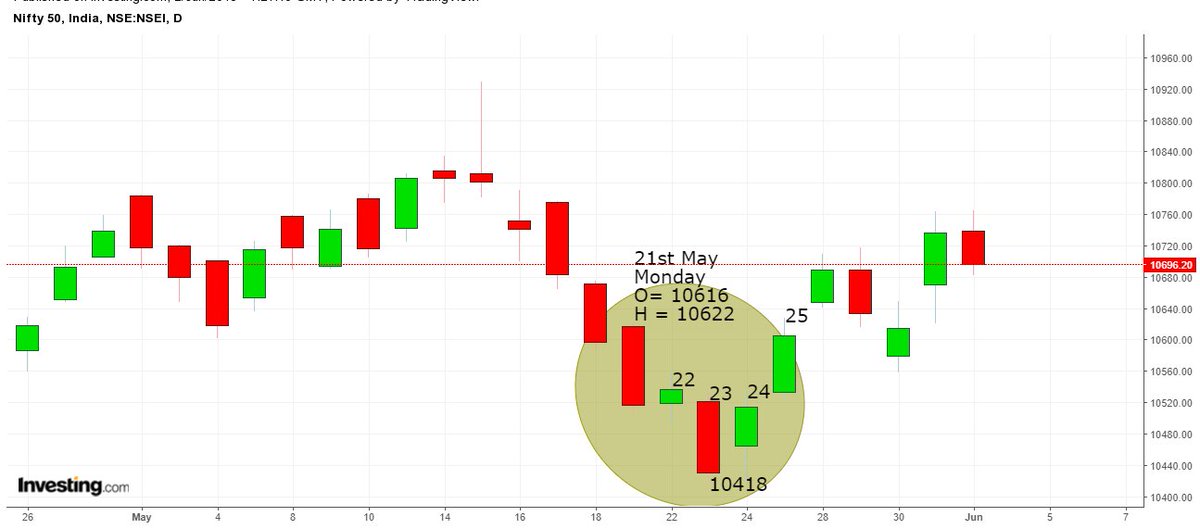
recent such setup occured on 21st may & gave a decent 200 pointer trade without using much brains (10/n)
recent such setup occured on 21st may & gave a decent 200 pointer trade without using much brains (10/n)
STOP LOSS
very simple as per Risk mgmt system .. generally my preferred wayto find a stop loss
1) 0.25% of trade execution level
(11/n)
very simple as per Risk mgmt system .. generally my preferred wayto find a stop loss
1) 0.25% of trade execution level
(11/n)
STOP LOSS
2) recent swing high low like on 1st june nifty made a high of 10764 and previous day high was 10764 and recent swing high was 10790.. So trade got executed at 10750 with stops as 10790 with no targets.. only stop loss were revised to carry on less risk
(12/n)
2) recent swing high low like on 1st june nifty made a high of 10764 and previous day high was 10764 and recent swing high was 10790.. So trade got executed at 10750 with stops as 10790 with no targets.. only stop loss were revised to carry on less risk
(12/n)
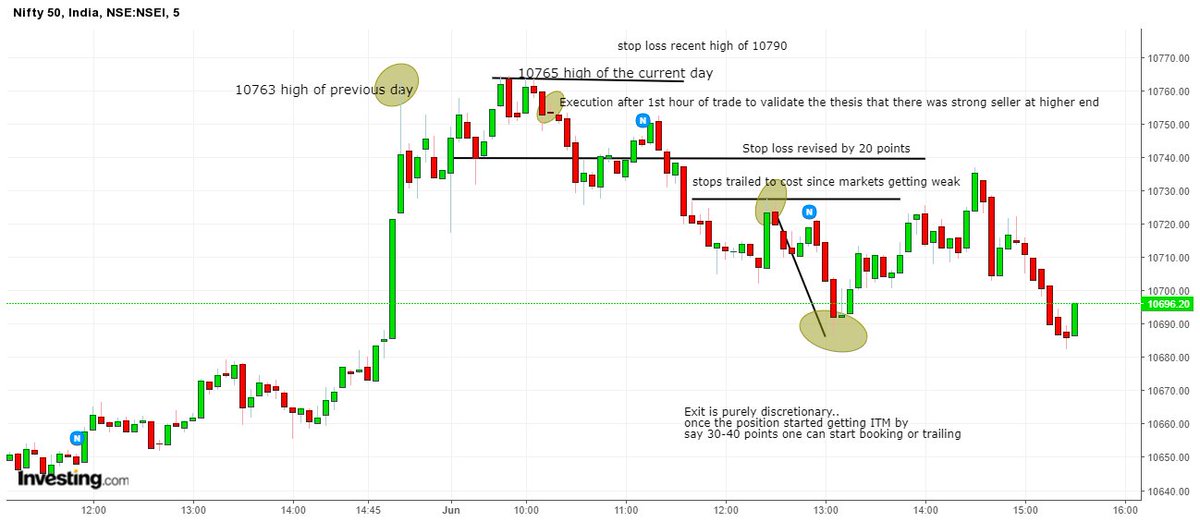
how to trail stops is purely discretionary as everyone have different RR
if trading intra then an hourly OHC / OLC or OH / OL would be signal to decide stop loss or booking out of a position...
(13/n)
if trading intra then an hourly OHC / OLC or OH / OL would be signal to decide stop loss or booking out of a position...
(13/n)
if trading on weekly basis stop losses need to be readjusted based on daily data
if trading on daily basis stop loss needs to be adjutsed based on hourly / 30 / 15 min TF
Idea is not to get caught on wrong footing
A STOP LOSS saved is a profit earned
(14/n)
if trading on daily basis stop loss needs to be adjutsed based on hourly / 30 / 15 min TF
Idea is not to get caught on wrong footing
A STOP LOSS saved is a profit earned
(14/n)
Remember we are here to make money and not systems ..
system may give late signal but since i am following a discretionary method the loss should be pre-defined
(15/n)
system may give late signal but since i am following a discretionary method the loss should be pre-defined
(15/n)
The End
(16/16)
(16/16)
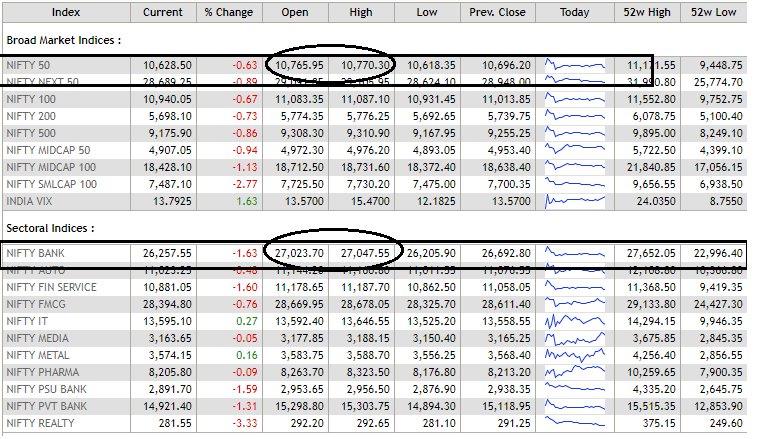
simplicity at best !! #nifty 150+ #banknifty 550+ #BNF points captured by the most simple methods !!
#KISS analysis
#KISS analysis
• • •
Missing some Tweet in this thread? You can try to
force a refresh


