,
15 tweets,
7 min read
Read on Twitter
#Nifty
Few points to ponder on Longer TF
- Rising Trendline since 2008 currently placed roughly around 9000 (Long TF)
- Rising Trendline since Dec. 2016 from 6825 have been breached on monthly basis and currently placed above 11300. so close above it is needed
1/n
Few points to ponder on Longer TF
- Rising Trendline since 2008 currently placed roughly around 9000 (Long TF)
- Rising Trendline since Dec. 2016 from 6825 have been breached on monthly basis and currently placed above 11300. so close above it is needed
1/n
Contd..
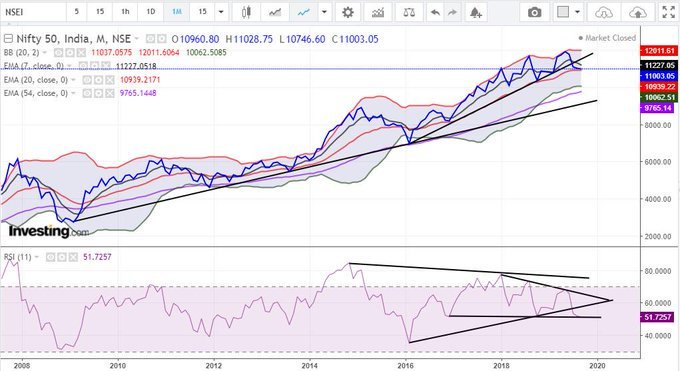
- breached 7 MEMA and tested 20 MEMA ( also middle BB)
What happend once 20 MEMA was breached ??
Only 3 instances of corrections
- Since 2003 in 2008 (Crash)
- 2011-12-13 (Minor)
- 2015 (deep)
* MEMA = Monthly EMA
2/n
- breached 7 MEMA and tested 20 MEMA ( also middle BB)
What happend once 20 MEMA was breached ??
Only 3 instances of corrections
- Since 2003 in 2008 (Crash)
- 2011-12-13 (Minor)
- 2015 (deep)
* MEMA = Monthly EMA
2/n
Contd...
- Since 2003 only once 54 MEMA have been breached that was in 2008 crash
- in 2011 & 2016 took support at 54 MEMA and reversed
- currently 54 MEMA is placed at 9765
3/n
- Since 2003 only once 54 MEMA have been breached that was in 2008 crash
- in 2011 & 2016 took support at 54 MEMA and reversed
- currently 54 MEMA is placed at 9765
3/n
Contd..
Bollinger band (BB)
- only thrice it have breached Middle BB
- 2008
- 2011-12-13
-2016
- Since 2016 have tested Middle BB 3 times once currently
- currently middle BB is placed at 10940
4/n
Bollinger band (BB)
- only thrice it have breached Middle BB
- 2008
- 2011-12-13
-2016
- Since 2016 have tested Middle BB 3 times once currently
- currently middle BB is placed at 10940
4/n
Contd...
- Since 2003 only thrice have it touched lower BB
- 2008 , 2011 & 2016
- currently lower BB is placed at 10062
5/n
- Since 2003 only thrice have it touched lower BB
- 2008 , 2011 & 2016
- currently lower BB is placed at 10062
5/n
Contd...
RSI (11) placed at 51.73
- since 2014 there is bearish divergence
- after hitting high in jan 2018 there is continuous bearish divergence
- have breched low of 51.87 made in oct 2018
6/n
RSI (11) placed at 51.73
- since 2014 there is bearish divergence
- after hitting high in jan 2018 there is continuous bearish divergence
- have breched low of 51.87 made in oct 2018
6/n
Contd...
- currently nearing to 51.46 made in dec 2016 marked as support line
- broken triangle as clearly visible
7/n
- currently nearing to 51.46 made in dec 2016 marked as support line
- broken triangle as clearly visible
7/n
contd..
- Clear visible rising wedge breakdown
- to negate rising wedge breakdown need to cross 11300 odd
8 / n
- Clear visible rising wedge breakdown
- to negate rising wedge breakdown need to cross 11300 odd
8 / n

contd...
leaving TA behind for a while some data crunching
updated data courtesy
@ankitkall
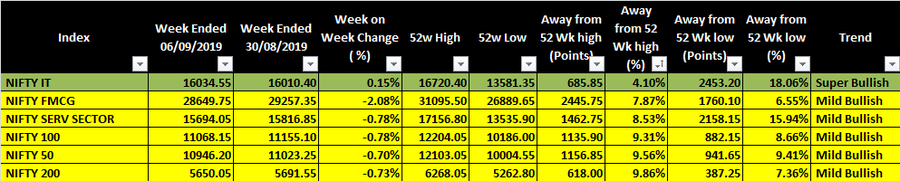
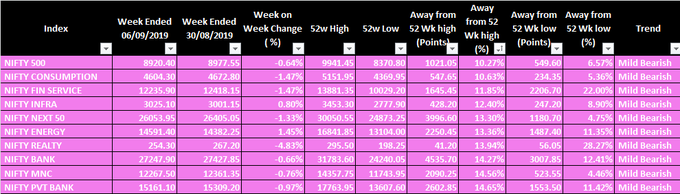
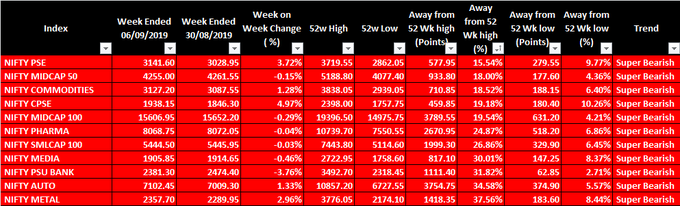
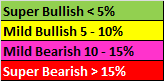
lets look at how different sectors are placed based on there difference from 52 week high
9/n
leaving TA behind for a while some data crunching
updated data courtesy
@ankitkall
lets look at how different sectors are placed based on there difference from 52 week high
9/n
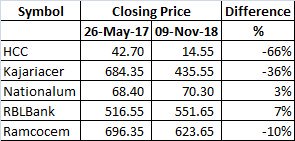
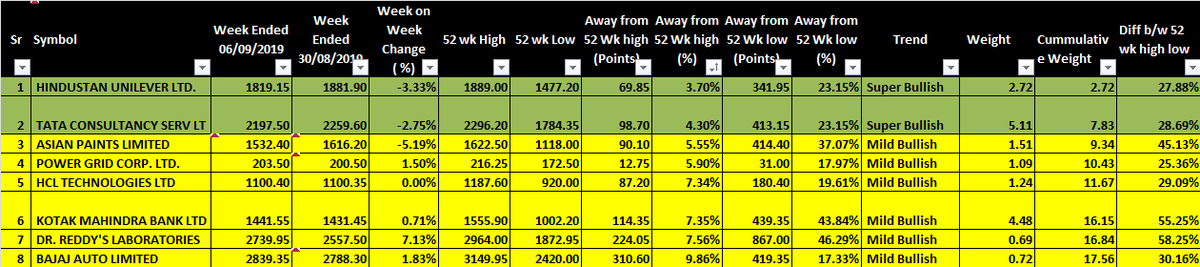
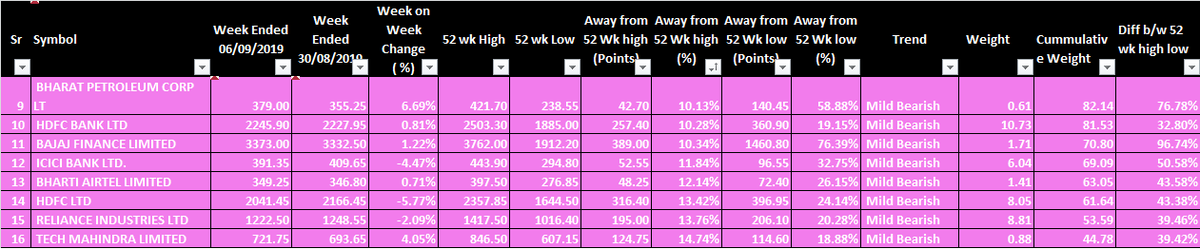
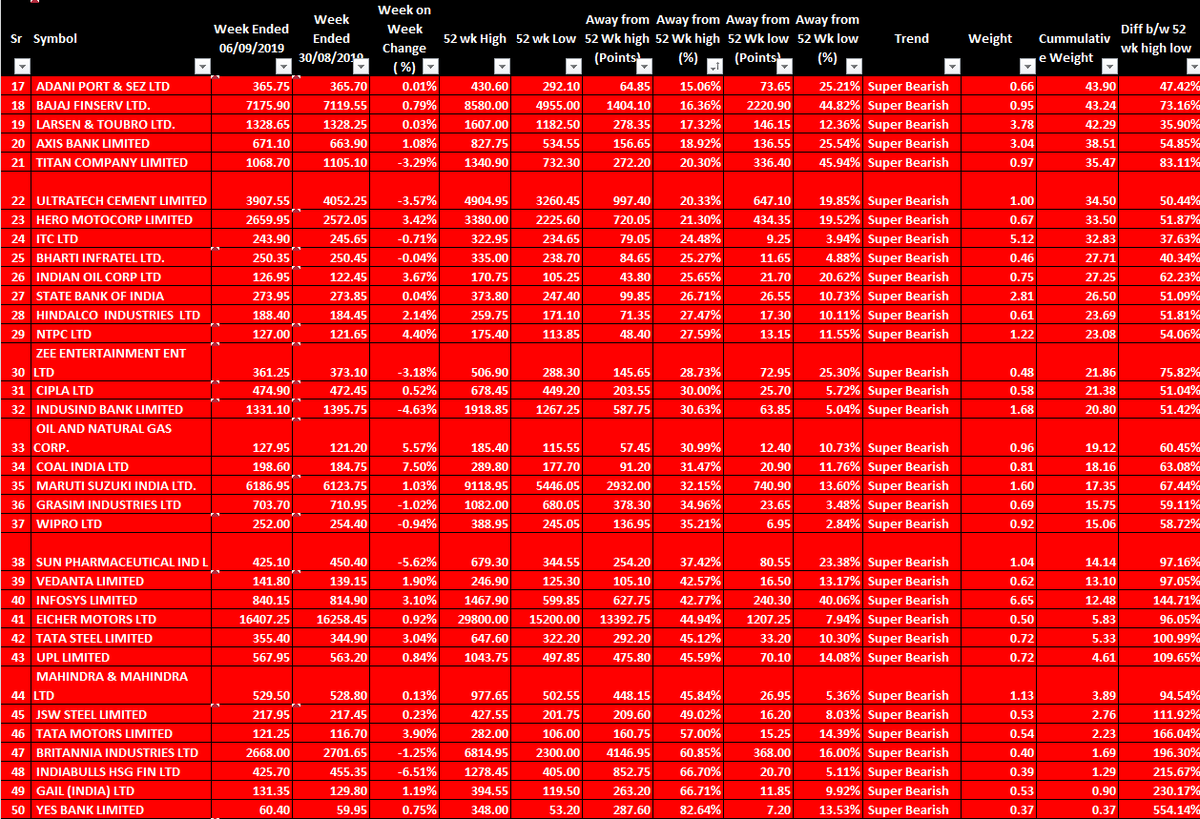
@ankitkall contd...
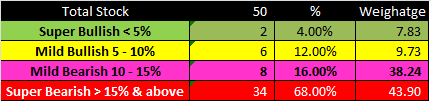
leaving TA behind for a while some data crunching on nifty 50 stocks
updated data courtesy
@ankitkall
lets look at how different stocks are placed based on there difference from 52 week high
10 / n
leaving TA behind for a while some data crunching on nifty 50 stocks
updated data courtesy
@ankitkall
lets look at how different stocks are placed based on there difference from 52 week high
10 / n
@ankitkall contd..
last tweet took 35 mins + 3 abuses... to write as data needed to be correct for better presentation !!
11/n
last tweet took 35 mins + 3 abuses... to write as data needed to be correct for better presentation !!
11/n
@ankitkall contd...
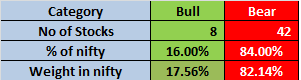
leaving TA behind for a while some data crunching on nifty 50 stocks and how bullish and bearish stocks are placed as a team
updated data courtesy
@ankitkall
leaving TA behind for a while some data crunching on nifty 50 stocks and how bullish and bearish stocks are placed as a team
updated data courtesy
@ankitkall
@ankitkall Contd...
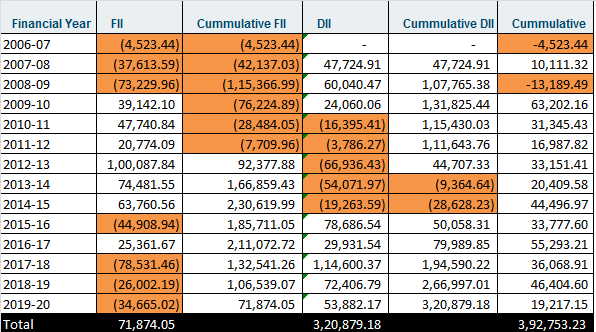
Looking at institutional data
- FII from peak cumulative buying of 2.30 Lk crore in 2014-15 there buying have dried up and is at 0.72 Lk crore currently
- Is this FII leaving India ??
- DII ( retail money ?? ) have entered market post 2015-16
13/n
Looking at institutional data
- FII from peak cumulative buying of 2.30 Lk crore in 2014-15 there buying have dried up and is at 0.72 Lk crore currently
- Is this FII leaving India ??
- DII ( retail money ?? ) have entered market post 2015-16
13/n
Contd...
- if 7k is taken as base and 12k as top ( for time being) and taking an average nifty cost comes to 9500 odd
- currently nifty at 11k
- hardly return of 16% cumulatively for 4.5 years ( FD is 7%)
14/n
- if 7k is taken as base and 12k as top ( for time being) and taking an average nifty cost comes to 9500 odd
- currently nifty at 11k
- hardly return of 16% cumulatively for 4.5 years ( FD is 7%)
14/n
Conclusion
Enough data suggests that this period of under performance can be attributed to one thing
- few stocks used to maintain Ms. Nifty so people still hanging on " HOPE " that broader market will catch up
- dumb money is still chasing rather then sitting out !!
15/end
Enough data suggests that this period of under performance can be attributed to one thing
- few stocks used to maintain Ms. Nifty so people still hanging on " HOPE " that broader market will catch up
- dumb money is still chasing rather then sitting out !!
15/end