
CORRECTED HEADLINE:
“Nurse and freshman member of Congress introduces important bill to significantly improve ACA until universal coverage can be passed in the future”
#ACA2 isn’t an *alternative* to MFA, it’s an important stopgap to improve things in the short term.
“Nurse and freshman member of Congress introduces important bill to significantly improve ACA until universal coverage can be passed in the future”
#ACA2 isn’t an *alternative* to MFA, it’s an important stopgap to improve things in the short term.
https://twitter.com/cbsnews/status/1121967170983006208
#ACA2 is desperately needed for the next few years REGARDLESS of whether we eventually move to MFA, Med4Am or some other universal coverage program.
ACA2 could be fully implemented pretty much immediately, possibly even retroactively for some provisions. MFA or even Med4Am (which I support) will take several years to ramp up, so at least some ACA2 provisions would still be needed in the meantime.
As for @LaurenUnderwood’s bill itself, here’s how much it would lower net ACA premiums: acasignups.net/19/04/11/how-m…
This table shows the *current* ACA subsidy formula: If you earn between 100-400% of the Federal Poverty Line ($12.5K - $50K if you're single, $25K - $100K for a family of 4), you only have to pay a maximum of the listed percent of income in premiums for a Silver ACA plan. 

As you can see, right now, if you're single and earn, say, $25,000/year (200% FPL), you only have to pay 6.54% of that in premiums for a Silver plan ($136/month). If you earn $40,000 (320% FPL), you only have to pay 9.86% ($329/mo) for the Silver plan.
There are two problems with the current formula: First, the subsidies simply aren't generous enough for many. Secondly, if you earn more than 400% FPL ($50K if you're single, $100K for a family of 4), you get NO help AT ALL. Zilch. @LaurenUnderwood's bill solves both issues.
Here's the *new* ACA subsidy formula under #HR1868. It shaves down the max % of income sliding scale (from 2 - 9.8% down to 0 - 8.5%), but it also *removes the 400% FPL eligibility cut-off* altogether, so a Silver ACA plan will never cost more than 8.5% of income no matter what.

What does this mean in the real world? The following graphs are based on average national premiums for 2019 Silver ACA plans for a single adult at 4 different ages (30, 40, 50 & 60 years old). ACTUAL impact will vary WIDELY depending on your age, state, income and household size.
First, let's look at a single 30-year old. In their case, the avg. Silver premium is around $376/mo in 2019, so removing the 400% FPL cap wouldn't do much for them...but those earning 100 - 450% FPL would still see a savings of up to around $1,100/year.

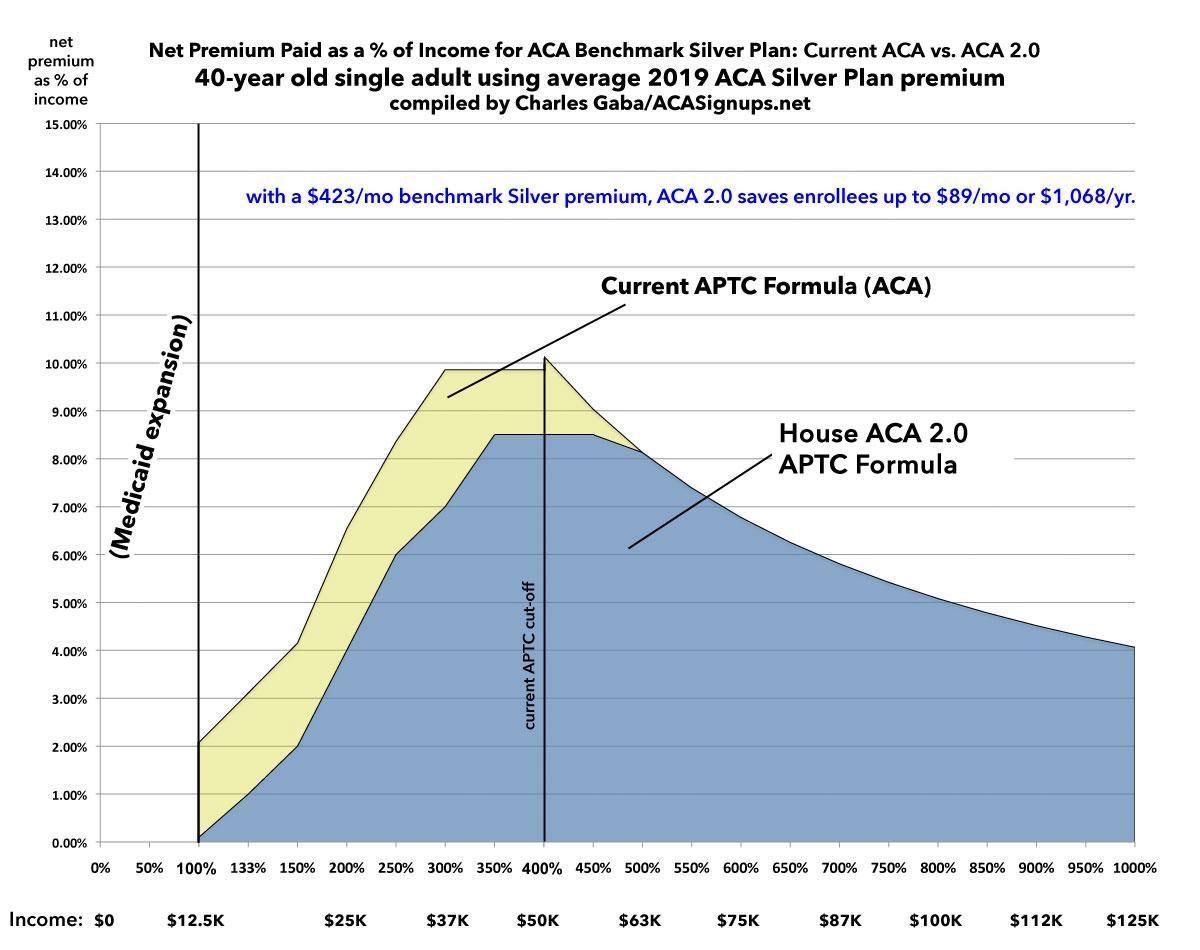
Next, the single 40-year old. From 100-400% FPL, they'd again save up to $1,100/year...but those earning between 400-500% FPL ($50K - $62K) would also save up to $800 or so compared to today.
How about at 50 years old? See that sharp spike at the 400% FPL line? That's called the "Subsidy Cliff". Right now a single 50-year old earning $49,960 receives $2,178 in financial assistance...but if they earn $49,961 (just $1 more!) they receive NOTHING...zilch.

THIS is the biggest reason why many middle-income Americans have dropped ACA policies in favor of #ShortAssPlans and other types of "junk" insurance: If you're just a little over that 400% FPL line, ACA plans can eat up to 14% or more of your income. #HR1868 limits that to 8.5%.
Under #HR1868, a single 50-year old earning $50K - $87K would see their annual premiums reduced by as much as $237/month or over $2,800/year vs. what they have to pay today, while those earning 100-400% FPL would still save up to $1,100 vs current subsidies.
FINALLY, what about a single 60-year old? My guess is there's very few 60-year olds who earn more than $50K/yr ($68K for a couple) on ACA-compliant individual market policies, and you're about to see why that is.
WARNING: Sit down before looking at this graph.
WARNING: Sit down before looking at this graph.
Holy smokes. The average Silver premium for a single 60-year old in 2019 is $898/month, or nearly $11,000/year. Right now, if they earn $49,960, they'd qualify for an average of around $5,800/year in financial assistance...but if they earn just $1 more, that drops to nothing.

Under @LaurenUnderwood's #HR1868, again, NO ONE would have to pay more than 8.5% of their income for a benchmark Silver #ACA exchange plan. The 60-year old earning $50,000/year would go from paying over 21% of their income ($898/mo) to just 8.5% ($354/mo).
The best part is that the actual net cost of this wouldn't be nearly as much as you might think. Estimates seem to range from $6B - $18B/year depending on the overall increase in enrollment (at least a few million more people) and what the demographic mix of those folks is.
While that's still a lot of money, consider that Donald Trump's CSR cut-off in 2017, which he THOUGHT would SAVE around $10-$12 billion/year, is ironically actually COSTING the federal government nearly $21 billion MORE per year.
acasignups.net/19/03/03/dear-…
acasignups.net/19/03/03/dear-…
Oh, and for anyone who thinks ACA subsidies are simply “throwing money at insurance carriers”, note that every year we give employers $280 billion to provide private insurance coverage to 160 million employees & their families. That’s around $1,750 apiece.
taxpolicycenter.org/briefing-book/…
taxpolicycenter.org/briefing-book/…
The employers, meanwhile, typically cover around 70-80% of their employees premiums, or around $5,600/year.
peoplekeep.com/blog/what-perc…
peoplekeep.com/blog/what-perc…
By contrast, ACA subsidies average $6,168 per person for those receiving subsidies today. That’s more than employer coverage, but not THAT much more.
acasignups.net/19/04/05/final…
acasignups.net/19/04/05/final…
As @MakaniKeoni just noted, right now that only applies to those CURRENTLY receiving ACA subsidies. Divided across ALL ACA enrollees, it’s only $3,800 apiece...exactly why the #ACA2 bill is quite reasonable. Adding $1,800/ea would just bring them up to par with employer coverage.
If you assume the #ACA2 bill caused, say, 2 million more to enroll in exchange plans (from ~13 million to ~15 million), and increased average subsidies across ALL ACA Indy market enrollees from $3,800 apiece to, say, $4,500 apiece, that’d raise fed spending by $10.5 billion.
• • •
Missing some Tweet in this thread? You can try to
force a refresh


