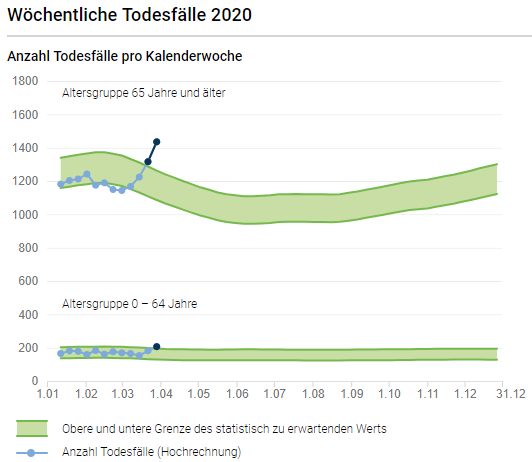
In general, we expect the number of deaths to average out fairly smoothly for the same times of year (though on average there are variations through the year)
2/n
Then we can plot the total number of deaths, from any cause, this year, on that plot.
3/n
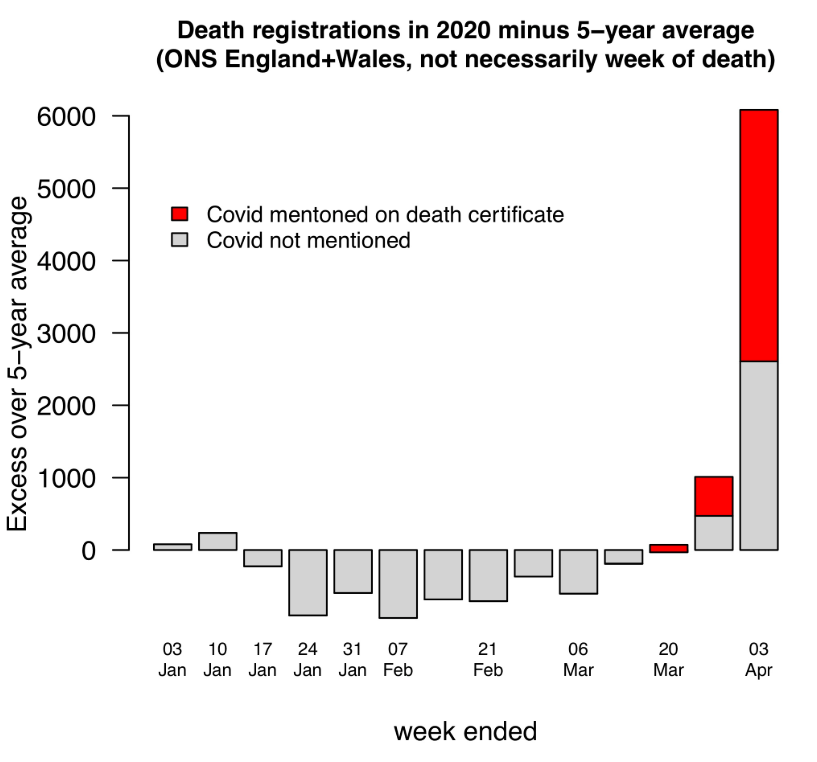
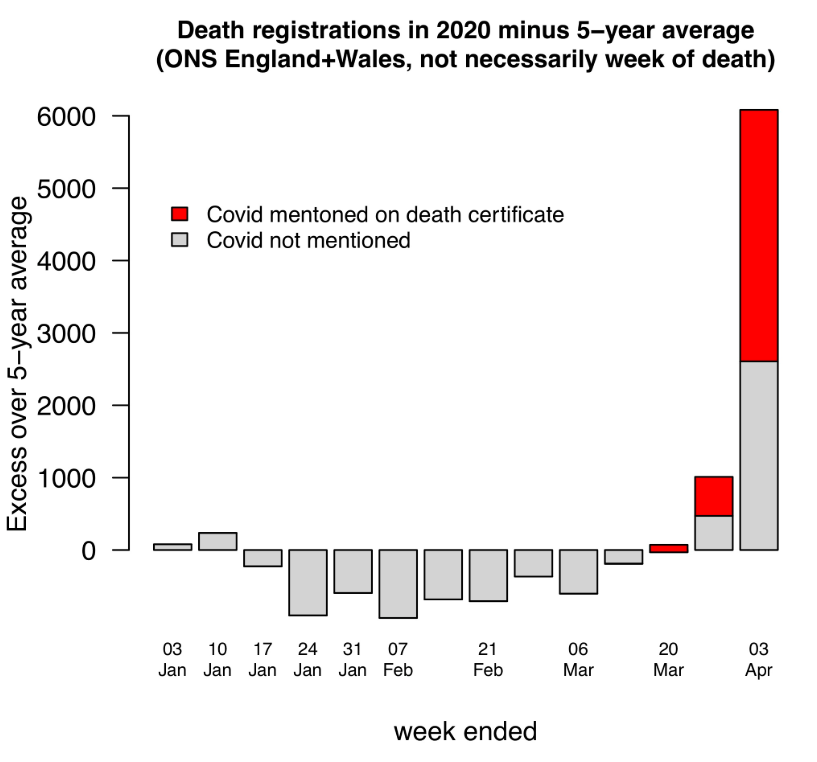
What can catch our attention is when deaths this year deviates far outside what we expect - "excess mortality"
4/n
5/n

7/n
10/n
Read more about our goal, why sequencing #SARSCoV2 matters, & donate here!
emmahodcroft.github.io/sequencing-fun…


