The consequences of the #covidcrisis are the macroeconomic topic of the day. Many observers & researchers compare the situation to the global financial crisis of 2008. A key difference is the large rise of household debt & asset prices that pre-dated the financial crisis. 1/17
In a new paper w/ Alina Bartscher, @MSchularick & Ulrike Steins, we explore the drivers behind the built-up of household debt in the U.S. before the financial crisis. We exploit newly available long-run microdata on the financial situation of households from 1949 to 2016. 2/17
This threat summarizes our key findings from “Modigliani Meets Minsky: #Inequality, #Debt & Financial #Fragility in America, 1950-2016” available here wiwi.uni-bonn.de/kuhn/paper/Hou… @ECON_tribute @UniBonn @ludwigstraub, @AtifRMian, @profsufi, @stef_alba, @GregWKaplan, @ben_moll, 3/17 
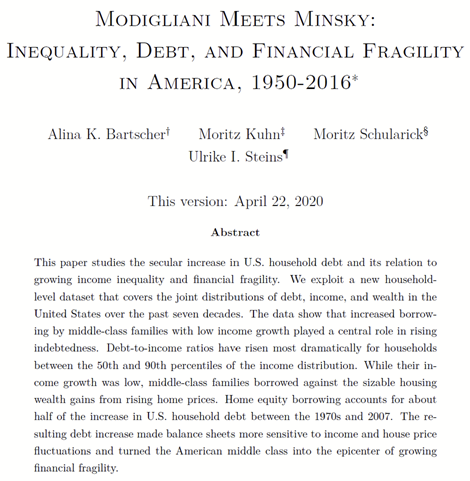
Rising indebtedness of U.S. households is a much-debated phenomenon. The numbers are eye-catching. Between 1950 & 2008, American household debt has grown 4-fold relative to income. In 2010, the household debt-to-income ratio peaked at 120%, up from 30% on the eve of WWII. 4/17
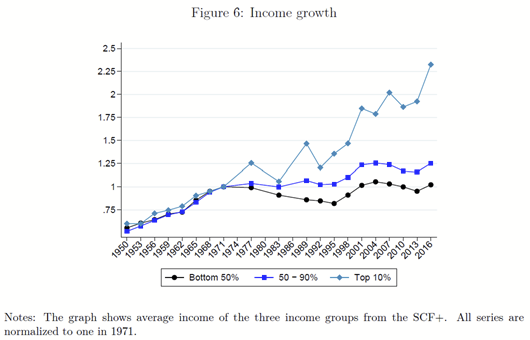
Rising income inequality is often invoked as an important factor. See recent work by @ludwigstraub, @AtifRMian & @profsufi. The income share of the richest 10% increased from 35% to 50% between 1950 & 2016. Our paper completes the picture on borrowers’ financial situation. 5/17
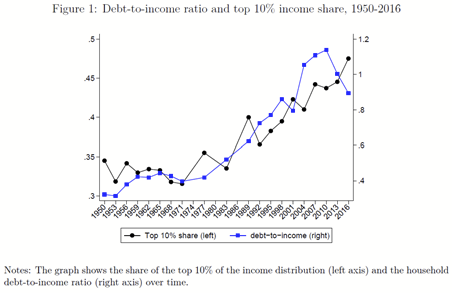
We rely on SCF+ data compiled from post-1983 SCF data & its predecessors. We group households by their income into 3 groups: bottom 50%, 50%-90%, & top 10%. The share of total debt owed by the three different income groups have been rather stable over time. 6/17

At the same time, there has been rising income #inequality. 7/17
Decomposing the debt increase, we find rising housing debt as the key driver of the aggregate debt increase. We identify four phases of the debt increase: two boom phases (1950-1965 and 1983-2007), followed by two periods of deleveraging (1965-1983 and 2007-2016). 8/17
While in the first debt boom from 1950-1965 more households started having housing debt (extensive margin), we find that during the second debt boom from 1983-2007 households started to having more housing debt (intensive margin). 9/17

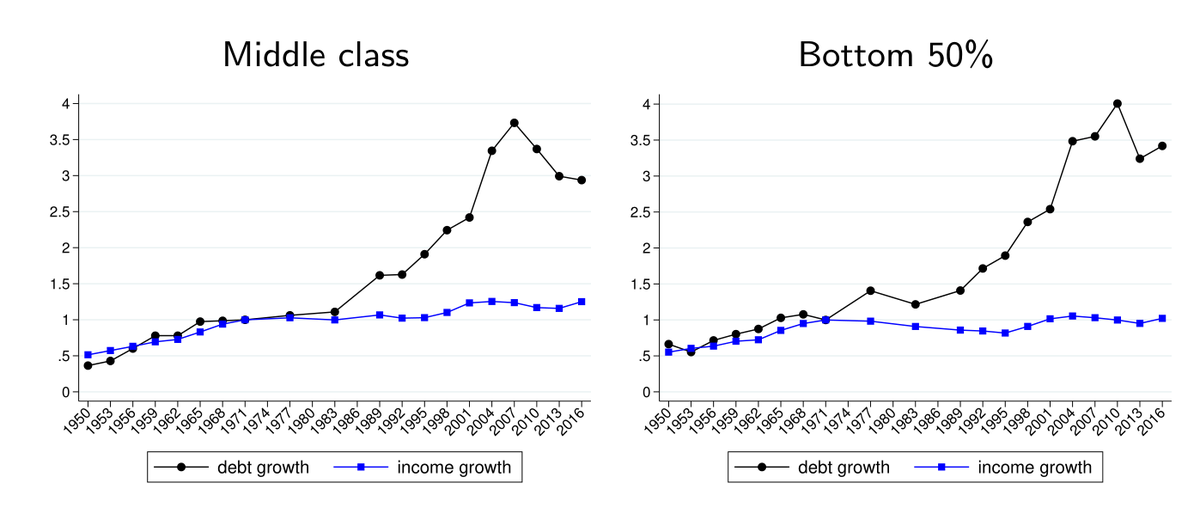
Especially middle-class households increased their debt levels relative to their incomes. Debt-to-income ratios have risen most dramatically for households between the 50th & 90th percentiles of the income distribution. 10/17
Does this mean that the American middle class got poorer? While their income growth was low, middle-class families borrowed against the sizable housing wealth gains from rising home prices. Wealth-to-income ratios grew even more than debt to income ratios. 11/17

Households got richer and borrowed against rising housing wealth. Home equity borrowing accounts for about half of the increase in U.S. household debt between the 1970s & 2007. 12/17

Without equity extraction, housing debt would have increased by half as much over the 1981 to 2007 period. Debt-to-income ratios would have stayed at around 40% until 2001 & increased only during the boom of the 2000s. 13/17

Equity extraction of the middle class accounts for the lion’s share of equity extraction & the largest part of the increase in household debt. We also explore the consequences of this surge in debt-financed equity extraction for financial stability of the macroeconomy. 14/17
The debt increase made balance sheets more sensitive to income & house price fluctuations & turned the American middle class into the epicenter of financial fragility. Relative to bank equity, financial risk from the more indebted increased fivefold between 1950 & 2008. 15/17

Our stress tests underscore the macroeconomic consequences of middle class borrowing. Financial fragility rose, when households reacted to rising house prices. To paraphrase Minsky, the seeds of the increase in financial vulnerability were sown in good times. 16/17
Our results point to an existing tension for regulation of debt markets when Modigliani meets Minsky. Through the lens of economic theory, equity extraction provides the opportunity for life cycle consumption smoothing but at the cost of higher financial fragility. The End! 17/17